How swing trading differs from day trading and investing
Swing trading, day trading and investing have different objectives, timeframes and strategies. Swing trading is a middle ground between investing and day trading. Let’s take a closer look.
| Day trading | Investing | Swing trading |
Timeframe | From seconds to hours, within a trading day. | From months to years. | From a few days to several weeks. |
Objective | Small but frequent profits from many trades. | Larger profits from capitalization and/or dividends with lower risks. | Larger profit compared to day trading, but within a shorter period than investing. |
Strategy | Uses small price movements, relies on technical analysis. | Focuses on long-term trends and potential, relies on fundamental analysis. | Combines both technical and fundamental approaches, tracks trends within a longer period than day trading. |
Risks | Higher due to rapid market volatility. Also day traders face leverage risks and specifics of stop-loss executions. | Generally lower, but there are interest rate, credit and inflation risks. Investors often have less control over their capital than traders. | Swing traders have to deal with overnight and weekend risks, market instability and stop-loss challenges. |
Popular swing trading strategies
1. Trend following
Trend following involves trading in the direction of an already established trend, using technical indicators to confirm momentum. The indicators to look at:
moving averages (for example, 50-day and 200-day MA). They help to identify trends: when a short-term MA crosses above a long-term MA (golden cross), it’s a bullish trend, while a bearish signal happens when the opposite occurs (death cross).
trend indicators. The average directional index, or ADX measures trend strength, while MACD (moving average convergence divergence) helps confirm momentum shifts.
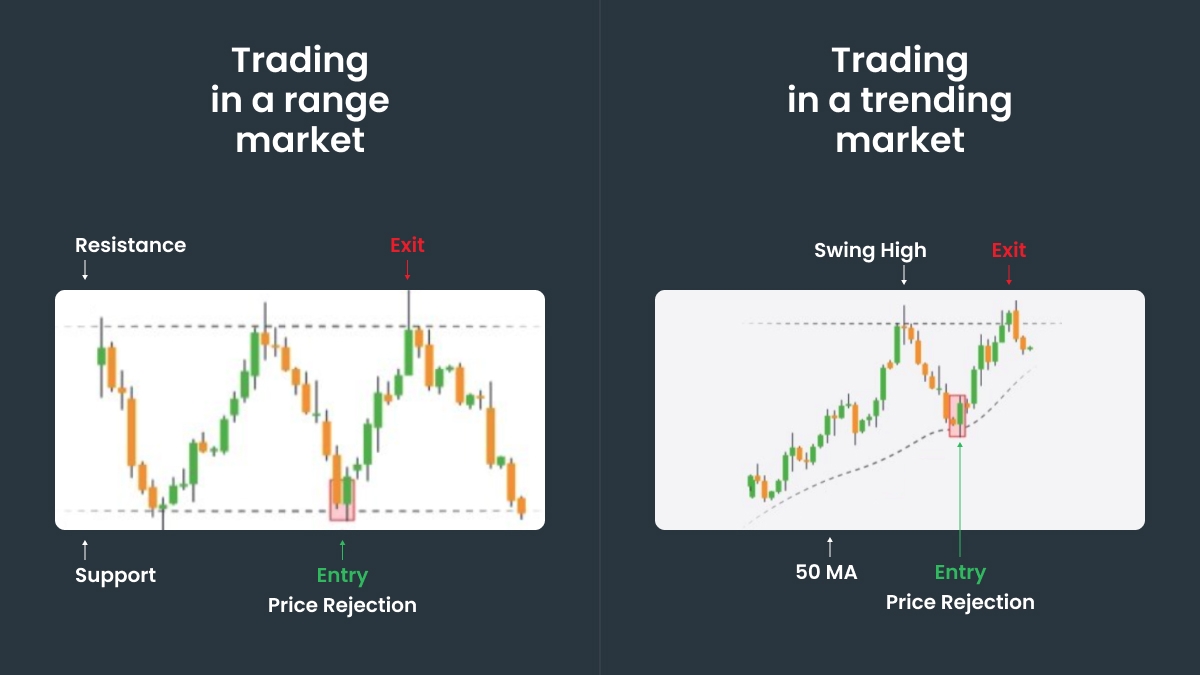
2. Support and resistance trading
This strategy focuses on key price levels where the market reverses:
Traders may buy near the support level and set a stop-loss just below it if a stock repeatedly bounces off it.
3. Breakout trading
This approach aims to capture price movements that occur after key levels break. To use it, first, look for price consolidation near a support or resistance level and wait for a breakout. Also confirm volume — high trading volume on a breakout suggests strong momentum.
4. Reversal trading
Reversal trading is about finding opportunities when a trend is losing momentum. Traders use the RSI (relative strength index) or MACD to spot momentum weakening before a trend reversal. Patterns like doji, hammer, or engulfing candlesticks also signal potential trend reversals.
Key indicators used in swing trading
Moving averages
MA helps identify trends and support or resistance levels.
Entry signal: buy when the 50-day MA crosses above the 200-day MA (golden cross).
Exit signal: sell when the price drops below the 50-day MA in an uptrend.
Relative strength index (RSI)
RSI measures momentum and overbought (or oversold) conditions (0-100 scale).
Moving average convergence divergence (MACD)
MACD is helpful when you want to identify trend changes and momentum shifts.
Bollinger bands
Bollinger bands are invaluable if you want to measure price volatility and potential reversals.
How to develop a swing trading strategy
Step 1: Identify a market trend
Moving averages, trend indicators, and chart patterns are great tools to identify the current trend in the market. After you’ve found one, look for confirmation across multiple timeframes — make sure it’s a long-term trend, not just a fluctuation. For example, if you see a 50-day moving average that is above a 200-day moving average (and both are going upwards), this is definitely a trend.
Step 2: Choose an entry point
What is the optimal entry point? It could be during a pullback to a key support level or a breakout above a resistance, but make a decision based on the trend you identified in Step 1.
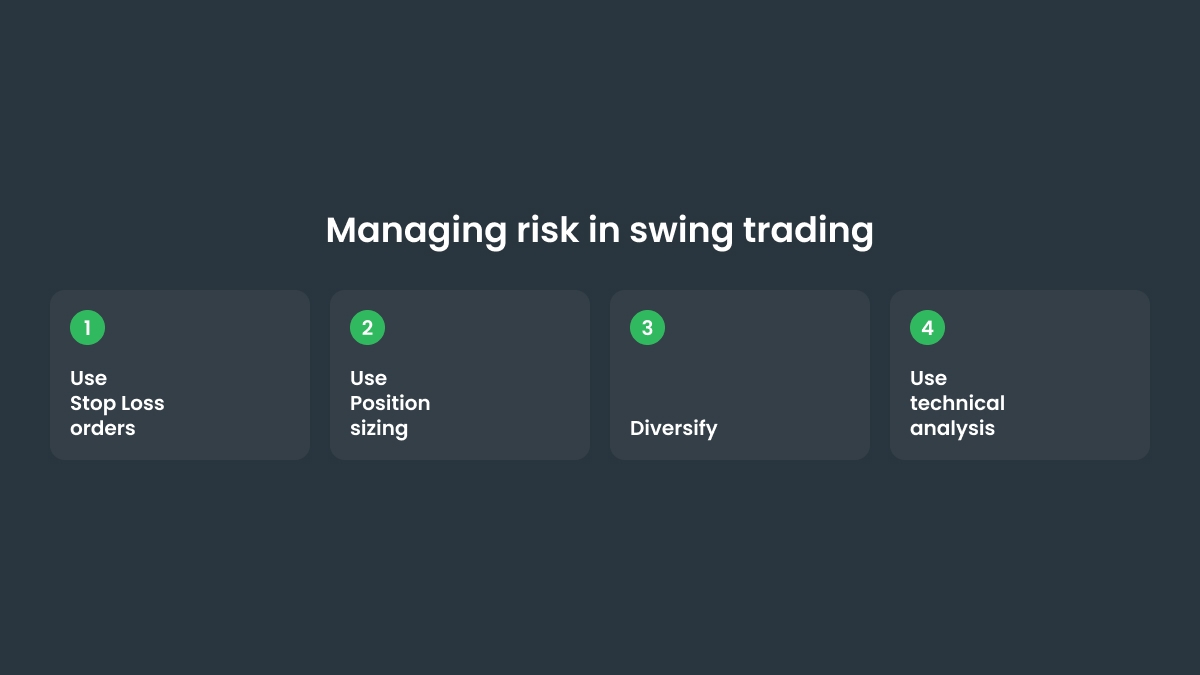
Step 3: Set stop-loss and take-profit levels
Risk management is everything: limit potential losses with a stop-loss order, which serves as a safety net. Take a specific percentage of the position, a key support level, or a technical indicator into consideration. The take-profit level can be based on a target price or key resistance level.
Step 4: Monitor and adjust your trades
Closely monitor the market and trade conditions, adjust stop-loss and take-profit levels if needed. If the trend isn’t favorable, consider closing the positions earlier to mitigate the risks and lock in the profit.
Want to improve your swing trading strategy and gain more profit? Go to FBS!
.jpg)