Estrategias de trading con MACD
Para aprovechar al máximo el potencial del indicador MACD, los traders pueden emplear algunas estrategias sofisticadas que te mostramos a continuación.
Cruces de líneas de señal
Un cruce de líneas de señal ocurre cuando la línea MACD corta la línea de señal. Estos cruces pueden tener dos significados diferentes:
Señal de compra
Cuando la línea MACD sube y cruza la línea de señal, muestra un impulso alcista.
Señal de venta
Por el contrario, si la línea MACD cruza la línea de señal hacia abajo, es un impulso bajista y una posible oportunidad de venta.
Sin embargo, en mercados laterales o volátiles, estas intersecciones pueden dar señales falsas. Siempre es una buena idea agregar más indicadores técnicos o señales de confirmación para aumentar la confiabilidad de los cruces.
Cruces en la línea cero
Una línea cero, también conocida como línea central, divide un gráfico en un área positiva y un área negativa. Está formada por una combinación de líneas EMA rápidas y lentas. La línea MACD se mueve alrededor de esta línea. Cuando la línea MACD cruza la línea cero, los traders pueden confirmar la dirección de la tendencia predominante.
Cuando la línea MACD cruza la línea cero hacia arriba, el impulso negativo cambia a positivo, lo que puede indicar una posible tendencia alcista.
En pocas palabras, un trader puede comprar cuando el MACD sube por encima de la línea cero y mantener la posición hasta que el precio vuelva a estar por debajo de 0.
El cruce de la línea cero hacia abajo indica que el movimiento da una posible tendencia bajista.
Un trader puede vender cuando el MACD cae por debajo de la línea cero y cerrar la operación cuando el precio vuelve a subir por encima de cero.
Recuerda que este enfoque funciona mejor para movimientos fuertes del mercado y es menos eficiente en un mercado lateral, donde puede ocasionar pérdidas.
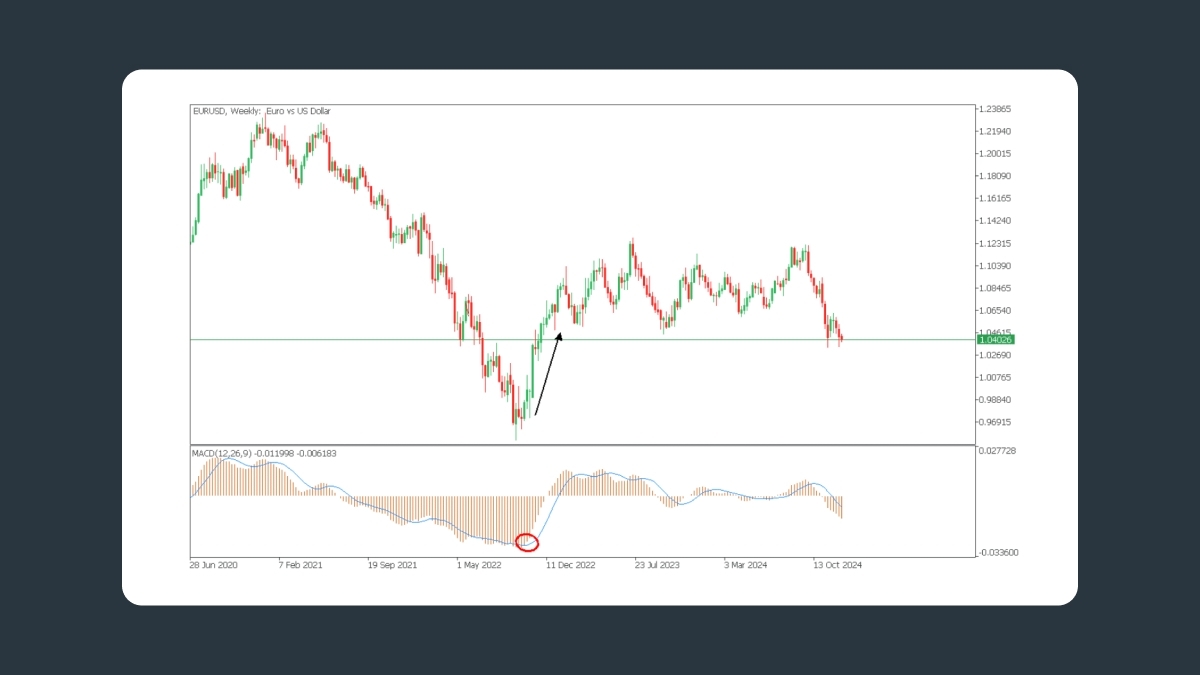
Análisis de divergencias
La divergencia entre el indicador MACD y el precio del activo puede ser una señal temprana de una próxima inversión de tendencia. Encontrar tales divergencias puede brindarte mucha información cuando buscas comprender la dinámica del mercado subyacente.
Señal de compra
Se produce una divergencia alcista cuando el precio muestra mínimos más bajos, mientras que en el MACD estos valores representan mínimos más altos. Esto demuestra que el impulso bajista se está debilitando y que es posible una reversión al alza.
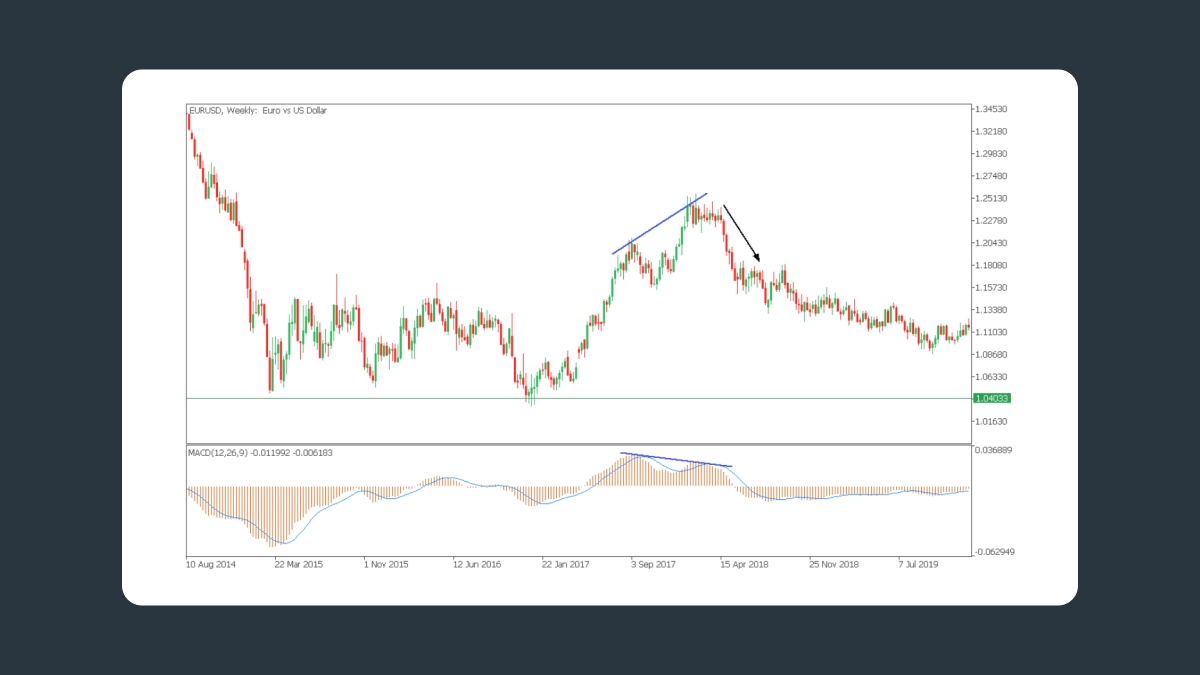
Señal de venta
Una divergencia bajista ocurre cuando el precio alcanza máximos más altos, mientras que el indicador MACD captura mínimos más bajos. Esta divergencia indica que el impulso alcista se está debilitando y es posible una reversión a la baja.
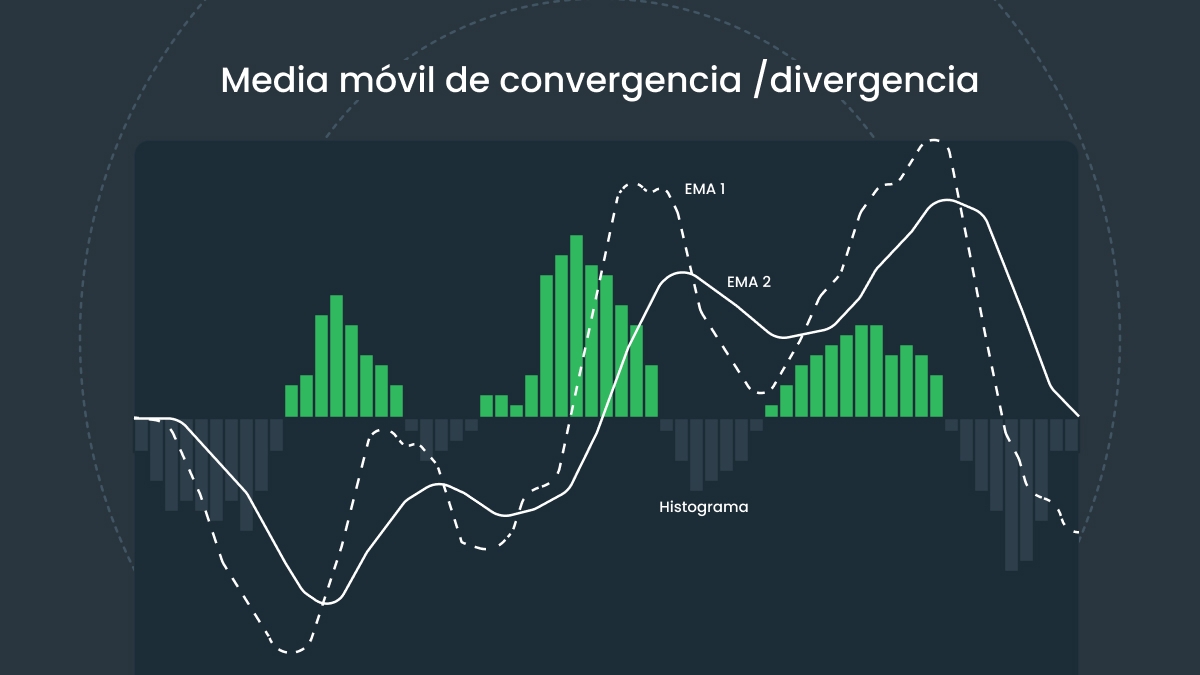
Análisis del histograma de MACD
El histograma ilustra visualmente la diferencia entre el MACD y las líneas de señal. Su comportamiento ayuda a los traders a interpretar la fuerza del impulso y los posibles cambios para tomar mejores decisiones sobre los puntos de entrada y salida.
Combinación del MACD con otros indicadores
Si bien el MACD es una herramienta potente, puede ser aún más eficaz cuando se combina con otros indicadores.
Índice de fuerza relativa (RSI)
Mientras que el MACD define la dirección y el impulso de una tendencia, el RSI muestra condiciones de sobrecompra y sobreventa. La combinación de estos dos indicadores te ayudará a analizar mejor el mercado al filtrar señales falsas y confirmar oportunidades prometedoras.
Medias móviles exponenciales (EMA)
Incorporar EMA de períodos más largos, como una EMA de 200 días, puede ayudarte a determinar mejor la dirección general de la tendencia. Los traders podrían considerar señales MACD que vayan en línea con la dirección indicada por estas EMA para aumentar la probabilidad de operaciones exitosas.
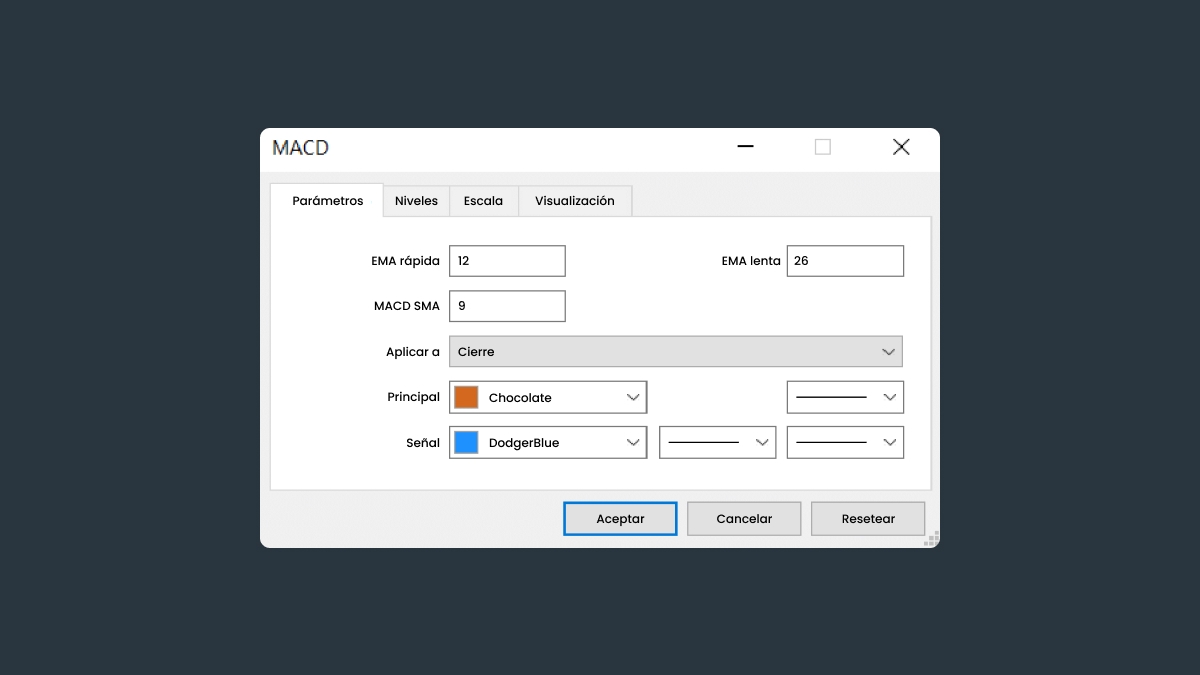
Cómo optimizar la configuración del MACD
Los ajustes predeterminados de MACD son 12, 26 y 9, y funcionan bien en la mayoría de las situaciones. Sin embargo, puedes editar estos valores para adaptar el indicador a tu estilo de trading y temporalidad específicos:
Trading a corto plazo
Si ajustas los valores en 5, 35 y 5, obtendrás señales más responsivas, adecuadas para el trading intradía.
Trading a largo plazo
Por el contrario, si eliges valores más altos, puedes suavizar el ruido y alinearte con horizontes de inversión más extensos.
Puedes probar diferentes valores en una cuenta Demo para identificar aquellos que funcionen para tus instrumentos de trading y estrategias específicos.