.jpg)
A moving average (MA) is a powerful technical analysis tool that traders worldwide use to simplify complex price data and identify prevailing trends. Its simplicity, coupled with its adaptability, has made it an indispensable part of trading strategies. By filtering out the noise of random price fluctuations, moving averages create a smoother curve on charts, offering invaluable insights into market movements.
The genius of moving averages lies in their ability to summarize past price action over a particular period and present it as a dynamic, easy-to-read line. This data-driven approach enables traders to spot patterns that often go unnoticed in raw price data. Beyond trend identification, moving averages serve as the backbone for strategies designed to handle risk, interpret volatility, and pinpoint market entry or exit points with precision.
Open a demo accountTypes of moving averages
There are several types of moving averages, each tailored to different trading scenarios and preferences. Here’s a breakdown of the most commonly used types, along with insights into their strengths and practical applications.
1. Simple moving average (SMA)
The SMA is the most basic form of a moving average, calculated by averaging the closing prices over a set time period. If you’re tracking a 50-day SMA, you add the closing prices of the last 50 days and divide the total by 50.
The primary advantage of an SMA is its steadiness, making it an excellent choice for monitoring long-term trends.
Traders often monitor the 200-day SMA in the stock market to get a big-picture view of a security's overall trajectory. However, this simplicity comes at a cost — it reacts more slowly to recent price changes, sometimes failing to capture quick shifts in momentum.
2. Exponential moving average (EMA)
The EMA addresses the lagging nature of the SMA by assigning more weight to recent prices. This responsiveness makes it ideal for short-term traders who need immediate feedback on market conditions.
A day trader navigating fast-moving currency pairs may use a 10-day EMA to spot short bursts of activity. Its ability to react quickly allows traders to jump into trends earlier, albeit at the cost of being more prone to false signals during choppy market conditions.
3. Weighted moving average (WMA)
The WMA represents a middle ground between the SMA and EMA by assigning varying degrees of weight to price points, with the most emphasis on recent data. This nuanced calculation makes it a versatile option when you need both responsiveness and stability.
Traders tracking intermediate-term trends might rely on the WMA to balance responsiveness to new developments with the clarity of a broader trend.
Choosing the right moving average
Selecting the most effective MA depends on your trading goals. If you prefer a slower, more measured approach, the SMA might suit your needs, whereas the EMA or WMA could prove invaluable for fast-moving markets like forex or cryptocurrency. A useful rule of thumb is to test different types of MAs across varying timeframes to find what aligns best with your trading style.
How moving averages enhance trading strategies
Moving averages hold value far beyond trend identification. By interpreting their behavior, traders can uncover new layers of market dynamics. Here’s how MAs can enrich your trading toolbox.
Trend identification and confirmation
Perhaps the most straightforward use of a moving average is to determine the market’s trajectory. When an MA slopes upward and prices consistently stay above it, the market is in an uptrend. Conversely, a downward-sloping MA with prices trading below confirms a downtrend.
In the commodities market, a trader observing gold prices rising above a 100-day MA could interpret this as bullish sentiment. The ability to confirm prevailing trends can give you the confidence to stick with winning trades and avoid overreacting to minor pullbacks.
Additionally, pairing multiple MAs — one short-term and one long-term — provides further clarity. If a 20-day EMA remains above a 50-day EMA, trend progression is confirmed.
Dynamic support and resistance
Moving averages frequently double as adaptable support and resistance levels. Take an uptrend, for instance. Prices often gravitate back to a specific moving average before bouncing higher. A forex trader might use a 50-day MA as a reference point, waiting for the EURUSD price to pull back near that level before entering a long position.
Similarly, during a downtrend, moving averages act as resistance, serving as price ceilings that limit bullish rallies. This functionality helps traders plan entry or exit strategies with precise timing.
Crossovers
Crossovers are among the most popular signals derived from moving averages. They are widely recognized for their simplicity and effectiveness.
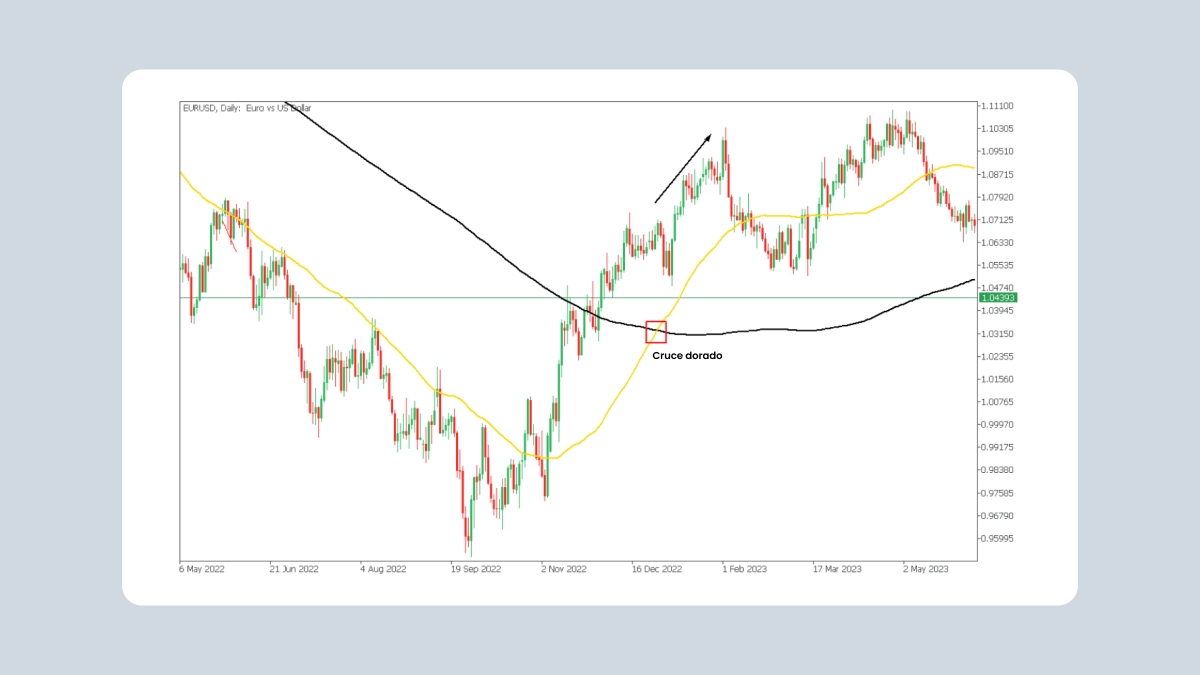
Consider this practical example in stock trading. If a mid-cap stock sees its 50-day SMA crossing over its 200-day SMA, traders interpret this as the start of a new bull market phase, potentially sparking buying interest on a larger scale.
Advanced techniques
For those ready to take moving averages to the next level, these advanced methods offer enhanced precision and deeper market insights.
Moving average envelopes
Envelopes create upper and lower bands around a moving average, calculated as a percentage above and below the MA line. Traders use these bands to identify overbought or oversold conditions. For example, if the price touches the upper band repeatedly, it may signal overextension, prompting traders to prepare for a pullback.
Moving average ribbon
Imagine plotting ten moving averages, ranging from 5 days to 100 days, all on the same chart. This is a moving average ribbon. The visual representation helps gauge trend strength and identify reversals. A ribbon that aligns cleanly and slopes upward signals a strong upward trend, while a contracting ribbon warns that the trend is losing steam.
Dual moving average strategies
Pairing different moving averages provides even more refined signals. A trader might use a 20-day EMA along with a 50-day SMA. When the shorter EMA crosses above the longer SMA, it’s a clear buy signal. Likewise, the reverse crossover signals a potential sell or short.
Advanced technique in practice
Suppose a trader applies the moving average envelope technique to crude oil futures. With envelopes set 3% above and below the 200-day SMA, they observe that the price has spiked past the upper band. This indicates that oil prices are overbought, suggesting a selling opportunity as the market cools.
Combining moving averages with other indicators
MAs pair seamlessly with other tools, creating powerful combos that boost accuracy and reduce false signals.
1. MACD
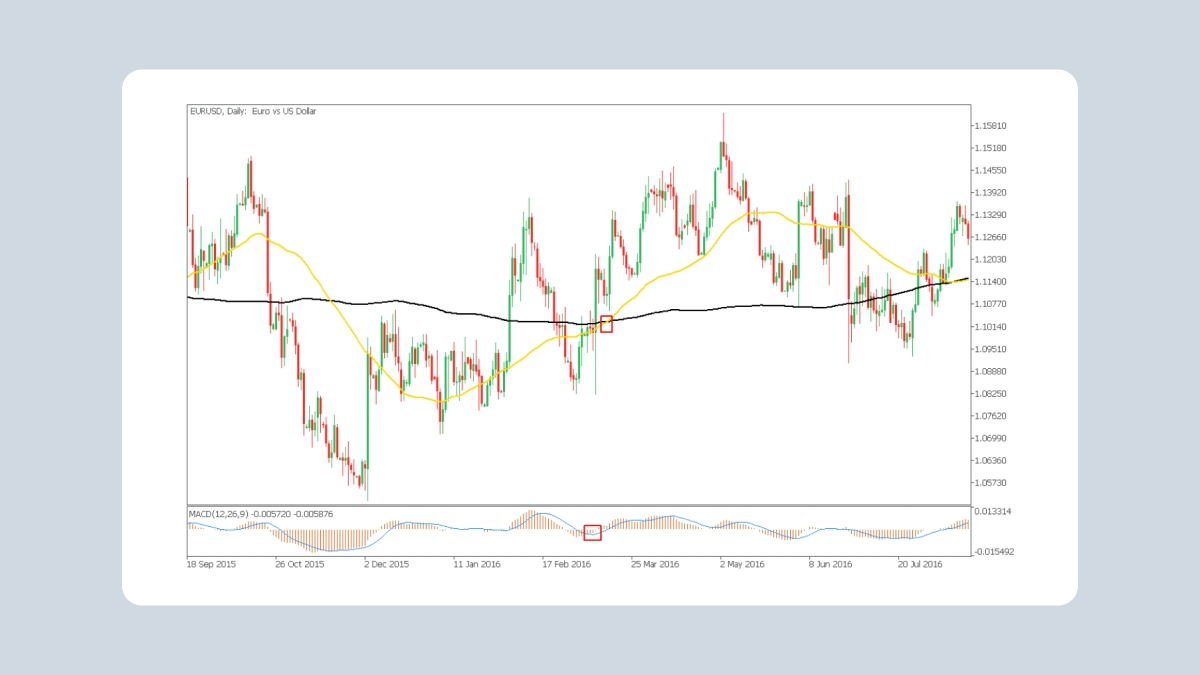
The moving average convergence divergence (MACD) indicator is built on EMAs, aking it an ideal companion to moving averages. If a bullish crossover in the MACD aligns with a golden cross in the MAs, it’s a robust buy confirmation. Conversely, bearish confluence signals strengthen the case for a downturn.
2. RSI
Coupling moving averags with the relative strength index (RSI) adds a momentum dimension.
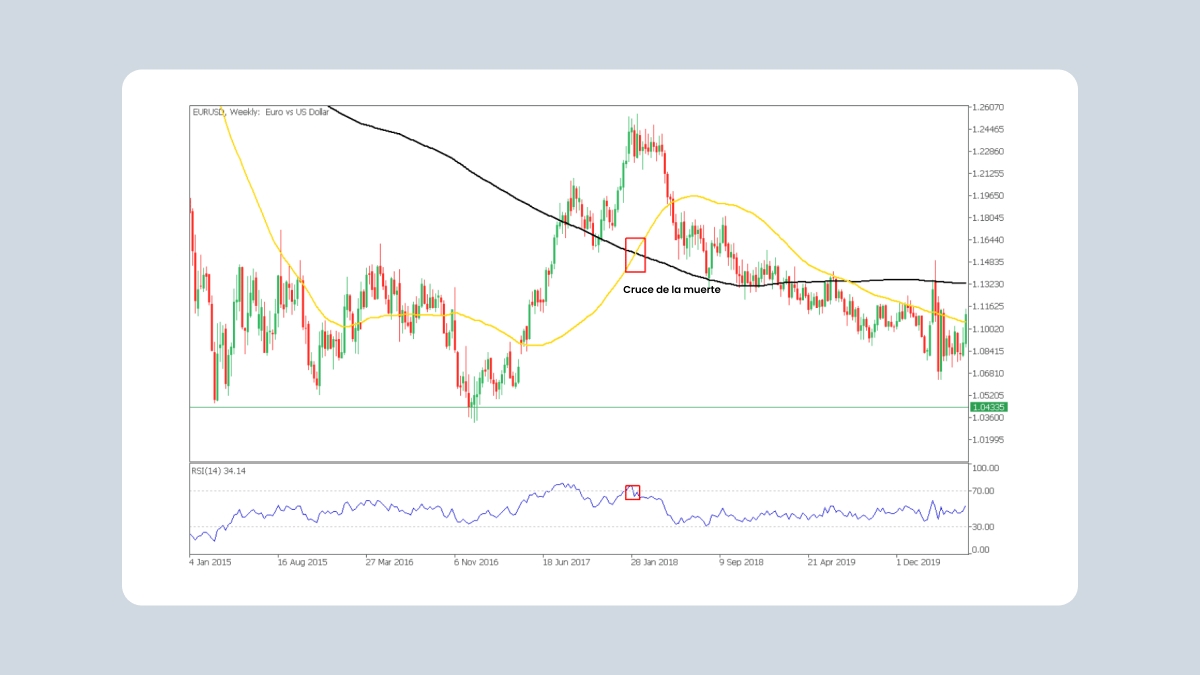
Imagine that a 20-day MA crosses above a 50-day MA while the RSI sits below 30. The oversold condition increases the likelihood of a meaningful upward reversal, offering traders confidence to initiate a long position.
3. Bollinger bands
Bollinger bands bring volatility into the mix by enveloping prices within upper and lower bands. If prices breach the upper band after a bullish MA crossover, traders interpret this as strong upward momentum. Alternatively, contracting bands paired with an MA breakout signal that a significant price shift may be imminent.
Practical applications
Across asset classes, moving averages offer consistent value.
Forex strategy
Picture a trader analyzing the USDJPY currency pair. A 20-day EMA along with a 50-day WMA shows the pair trending upward. When the 20-day EMA crosses above the 50-day, coupled with price clinging to the upper limit of moving average envelopes, the trader sees an optimal buy opportunity.
Stock scenario
Consider a scenario where a biotech stock consolidates just below its 200-day SMA. After a series of positive news events, the price dramatically breaks above the 200-day SMA on high volume, signaling a powerful breakout rally. Traders might use this move to establish long positions, confident that momentum will carry the stock higher.
Limitations of moving averages
Despite their many advantages, moving averages have limitations. Their reliance on historical data makes them lagging indicators, often delivering signals after the trend is already underway.
Additionally, in range-bound or sideways markets, MAs can generate misleading signals, with prices repeatedly crossing the MA without establishing a firm direction.
To mitigate these challenges, traders can extend timeframes to reduce the impact of noise or combine moving averages with other indicators, such as volume analysis, to refine market insights. Fundamental analysis can further complement MAs, providing a fuller trading picture.
Summary
Moving averages are cornerstones of technical analysis, offering clarity in complex markets and guiding traders toward more informed decisions. Mastering the nuanced applications of MAs — whether through simple techniques, advanced strategies, or indicator pairings — can help you build a trading edge.
By understanding their strengths and limitations, you’ll be better equipped to unlock their full potential, no matter your trading style or market of choice. Partnering moving averages with sound analysis and risk management will give you the confidence to tackle even the trickiest market conditions with precision.
Register now