
What is the ABCD pattern?
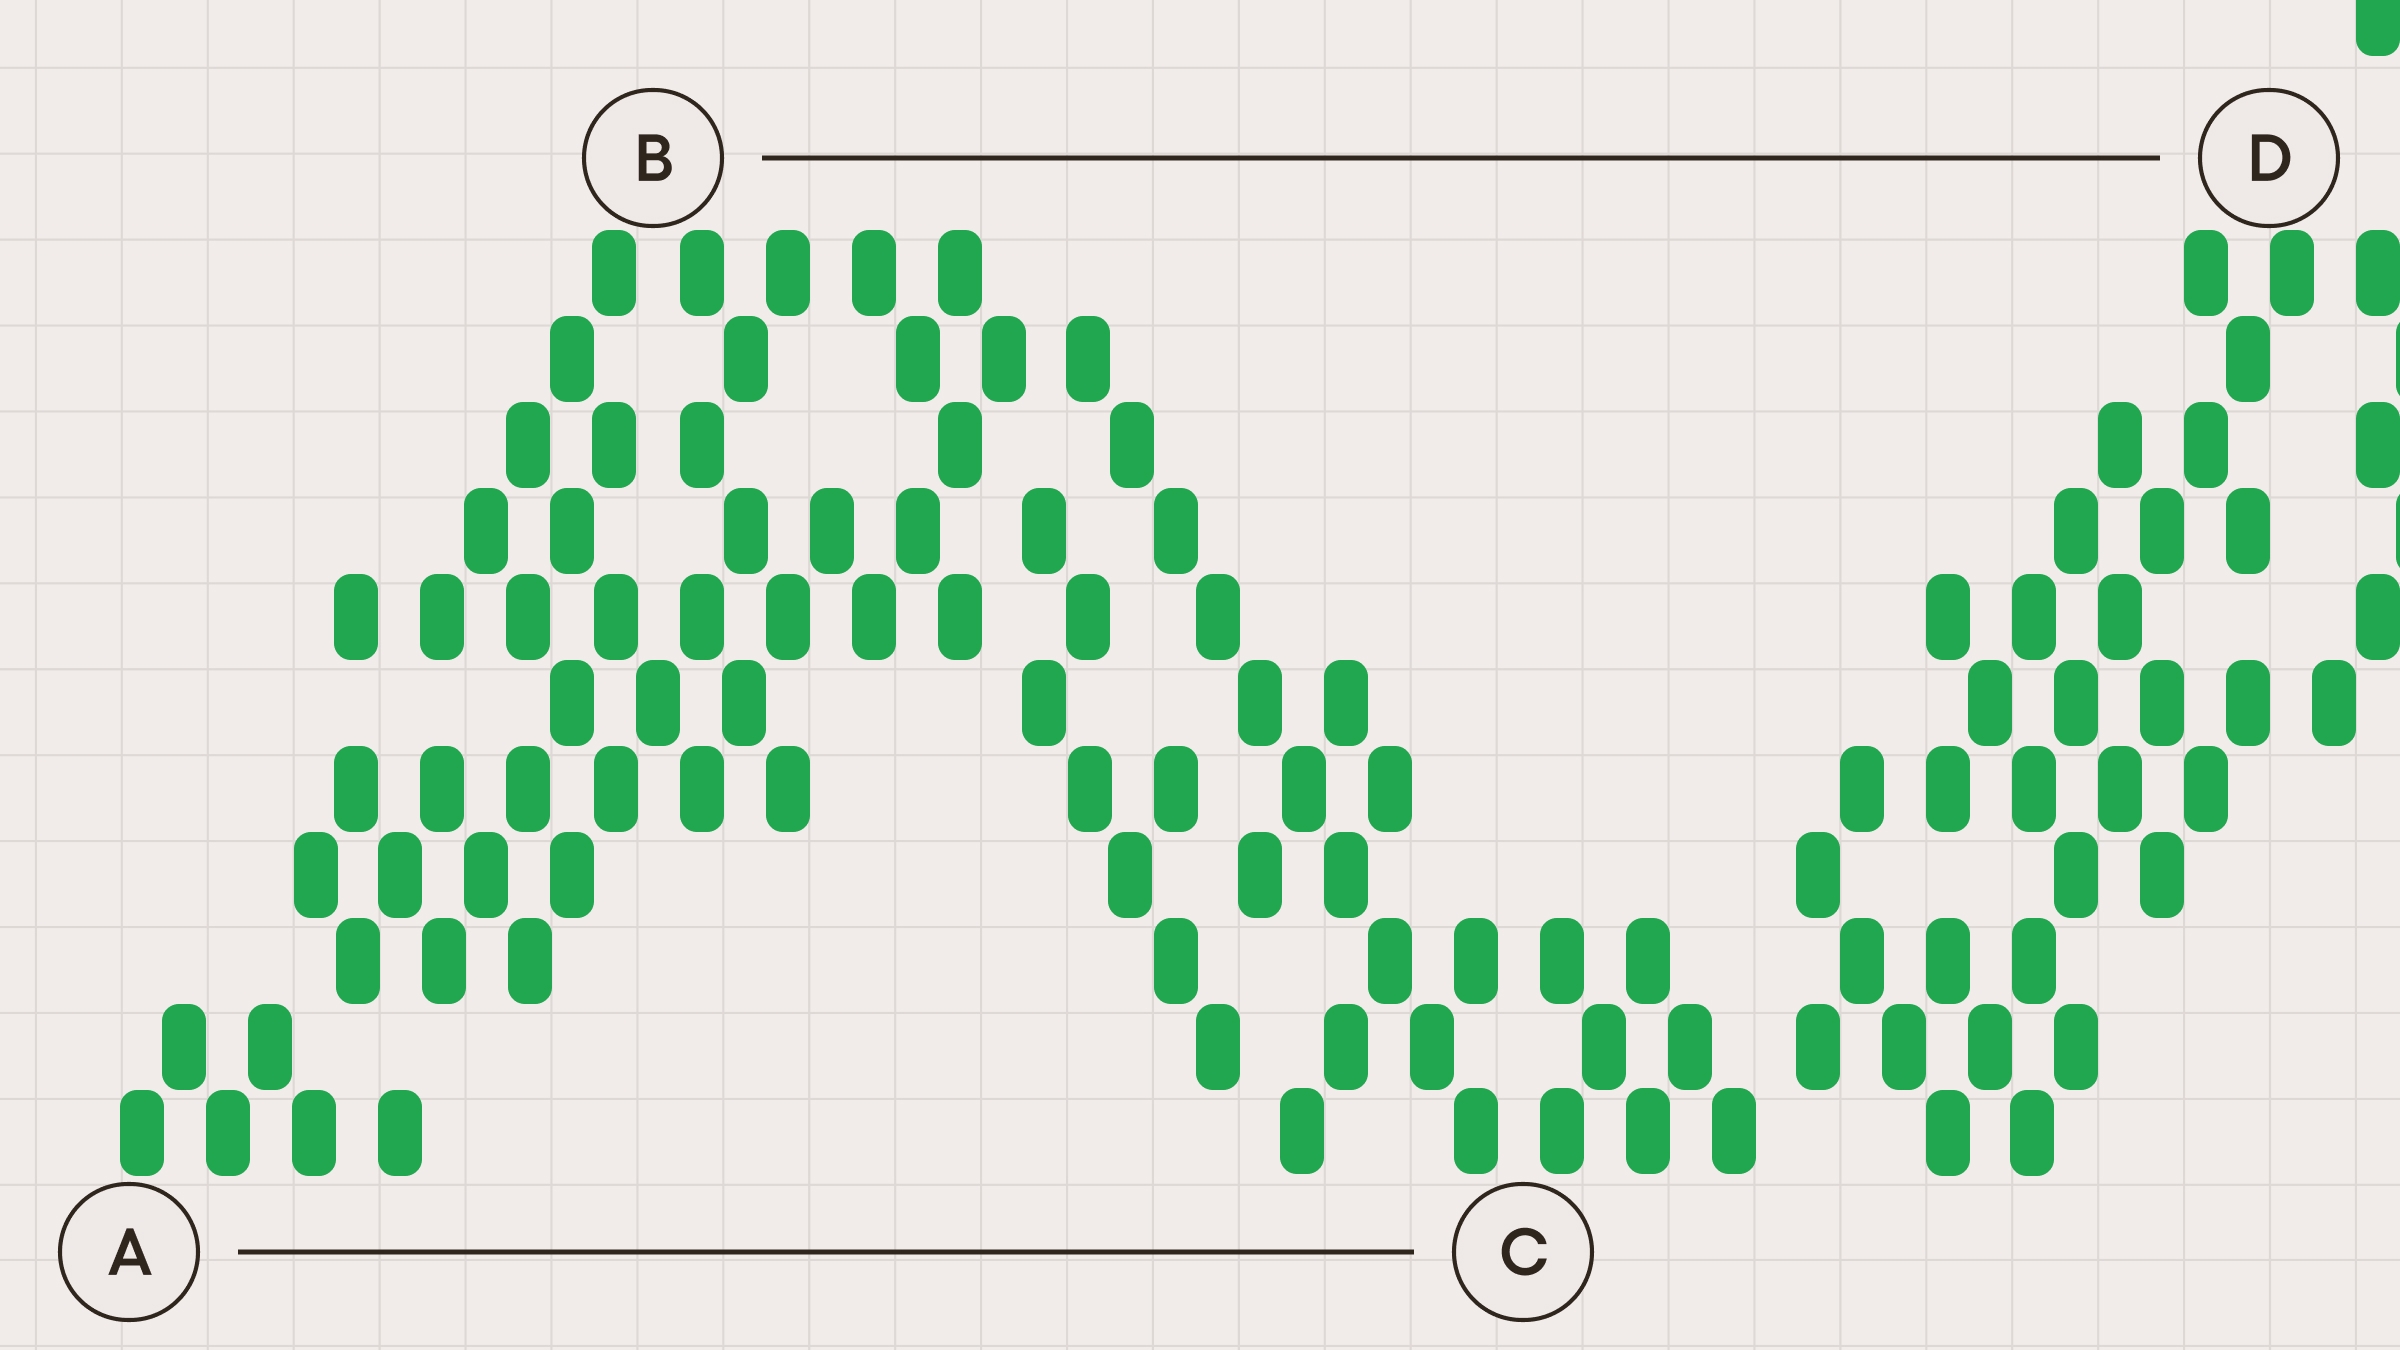
The ABCD is a basic harmonic pattern. All other patterns derive from it. The pattern consists of 3 price swings. The lines AB and CD are called “legs”, while line BC is referred to as a correction or a retracement. AB and CD tend to be approximately the same size.
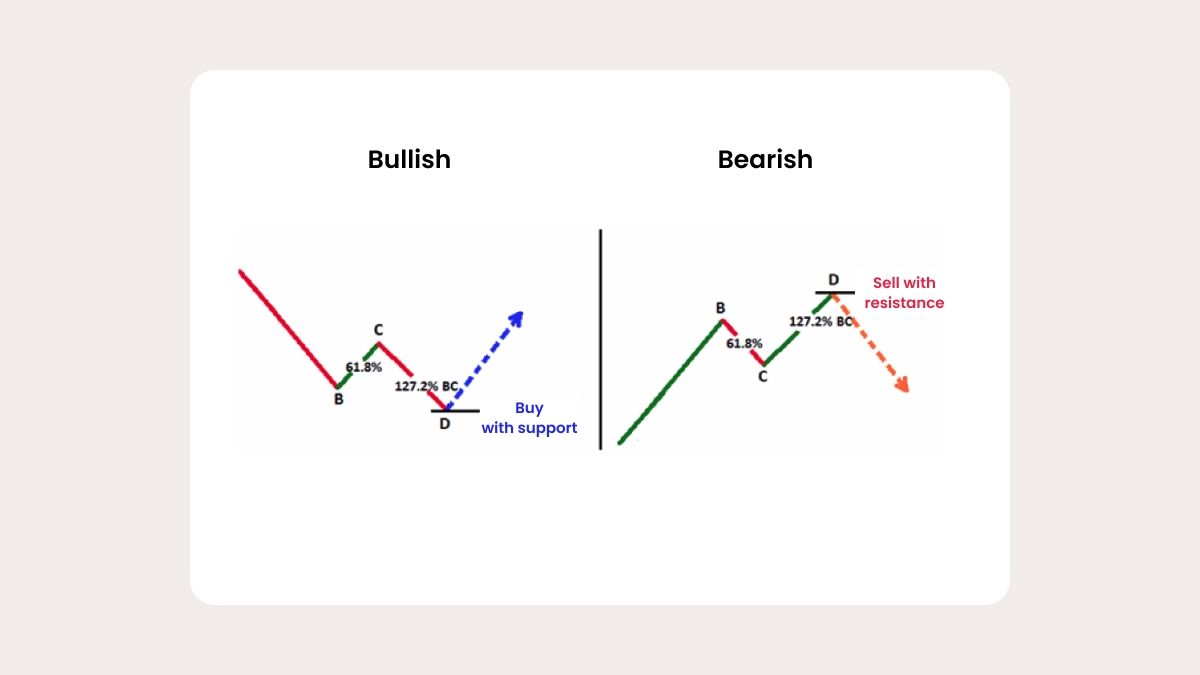
A bullish ABCD pattern follows a downtrend and means that a reversal to the upside is likely. A bearish ABCD pattern is formed after an uptrend and signals a potential bearish reversal at a certain level. The rules for trading bullish and bearish ABCD patterns are the same, you will just need to take into account the direction of the pattern you trade and the movement of the market it predicts.
Types of ABCD pattern
There are several types of ABCD pattern (all three patterns in the picture are bullish).
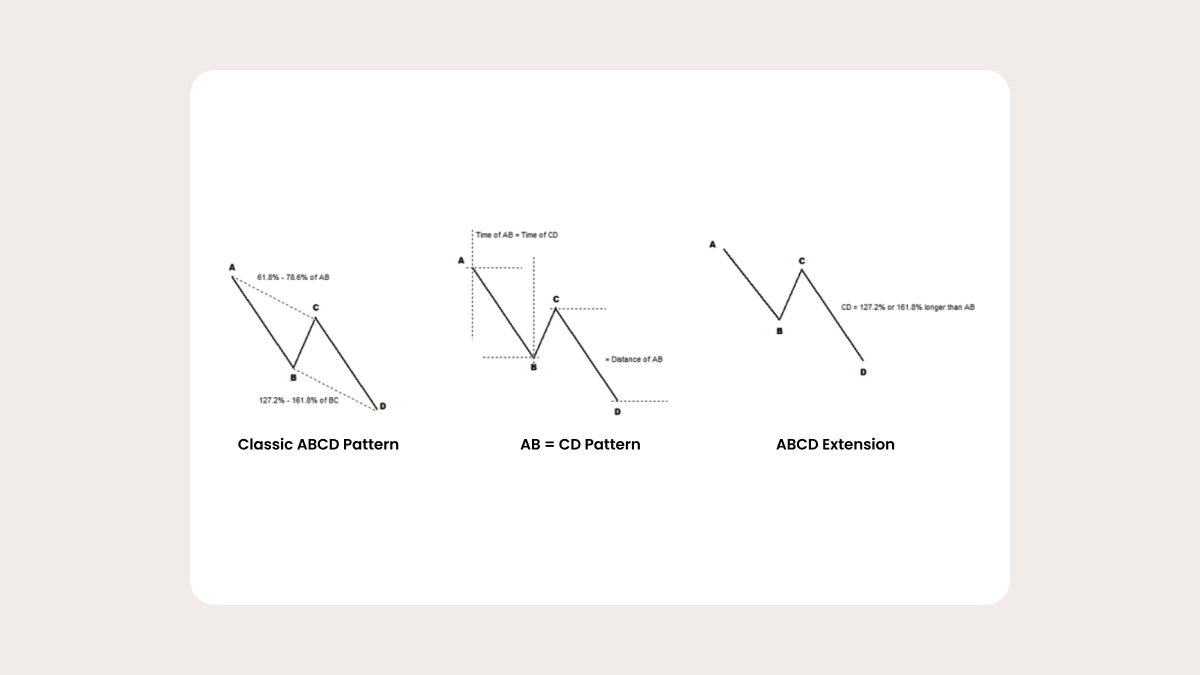
In the classic one, point C should be at 61.8%-78.6% of AB (use the Fibonacci retracement tool on AB: point C should be close to 61.8%). Point D should be at the 127.2%-161.8% Fibonacci expansion of BC. Note that a 61.8% retracement at point C tends to result in the 161.8% projection of BC, while a 78.6% retracement at point C will lead to a 127% projection.
There is also the so-called AB=CD pattern. Here, CD has exactly the same length as AB. In addition, it takes the market the same amount of time to travel from A to B as from C to D. As a result, AB and CD have the same angle. This type of ABCD pattern is seen quite often and is popular among traders.
The third type is when CD is the 127.2%-161.8% extension of AB. CD can even be 2 or more times bigger than AB. There are some signs that can predict when CD will be much longer than AB. These are a gap after point C, or big candlesticks near point C.
How to trade on the ABCD pattern
The key thing to remember is that you can enter the trade only after the price reaches point D.
Study the chart looking at the price’s highs and lows. It may be helpful to use the ZigZag indicator (Insert – Indicators – Custom – ZigZag), which marks the chart’s swings.
Watch the price as it forms AB and BC. In a bullish ABCD, C must be lower than A and should be the intermediate high after the low at B. Point D must be a new low below B.
When the market arrives at a point where D may be situated, don’t rush into a trade. Use some techniques to make sure that the price reverses up (or down if it’s a bearish ABCD). The best scenario is a reversal candlestick pattern. A buy order may be set at or above the high of the candle at point D.

Take-profit levels
Here are the target levels for trading on the ABCD pattern.
TP1: 38.2% retracement of AD
TP2: 61.8% retracement of AD
TP3: point A
We recommend using these levels together with support and resistance you identify on the chart using various technical analysis tools. Don’t forget to have a look at senior timeframes when you hunt for support and resistance levels.
If the price moves to TP1 fast, the odds are that it will continue towards TP2. On the contrary, if the price is slow to get to TP1, this might mean that it will be the only TP level you’ll get.
There are many cases when the market reversed after the AC=CD pattern going beyond point A.
As for the stop-loss, there are no special recommendations. You can put a stop-loss in line with your risk management rules.
Here's an example of the ABCD patterns on the chart:
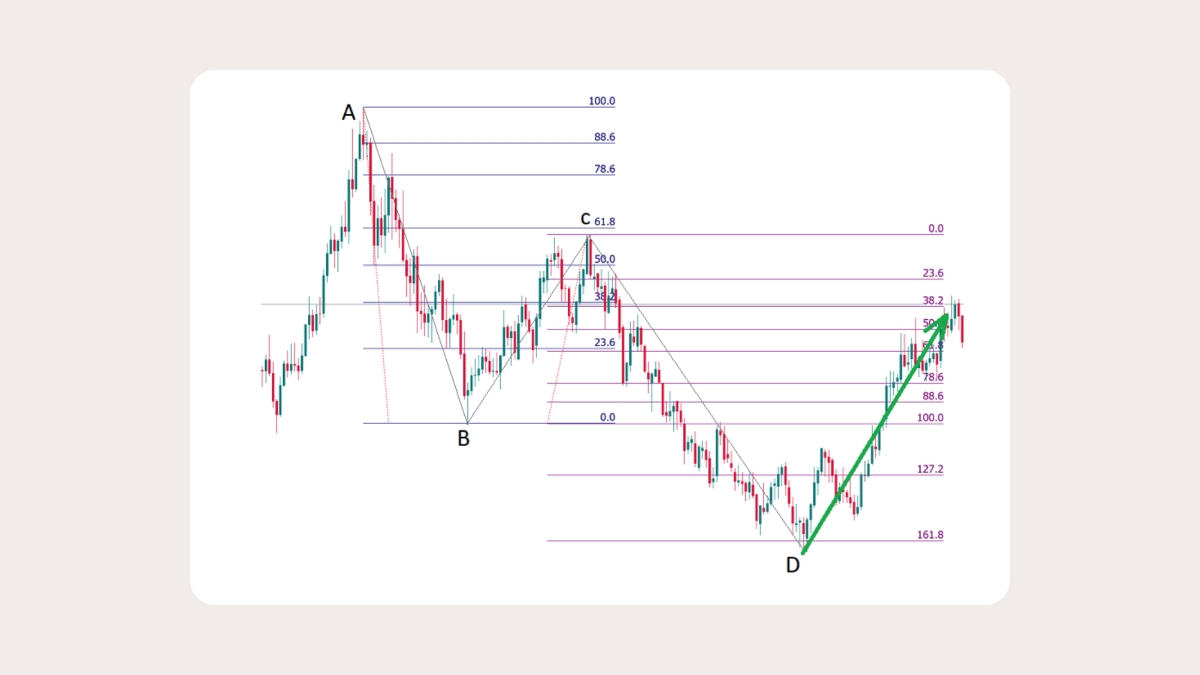
In the example we see the ABCD extension formation. CD is the 127.2%-161.8% extension of AB. CD is 2 times bigger than AB. Finally, after the formation is fully formed, the first target 38.2% is reached.
Summary
The ABCD pattern is extremely helpful and easy for traders to use. ABCD patterns offer clear buy and sell signals when trading high volumes. You can find many ABCD patterns on one chart. The rules for trading each of them are as explained above. Make sure that you know how to apply Fibonacci tools correctly and follow all our tips.