.jpg)
Características clave del patrón de cuña ascendente
El patrón de cuña ascendente es fundamental para el análisis técnico. Echemos un vistazo más de cerca a sus características clave.
https://www.bapital.com/technical-analysis/chart-patterns-list/rising-wedge
Forma y estructura
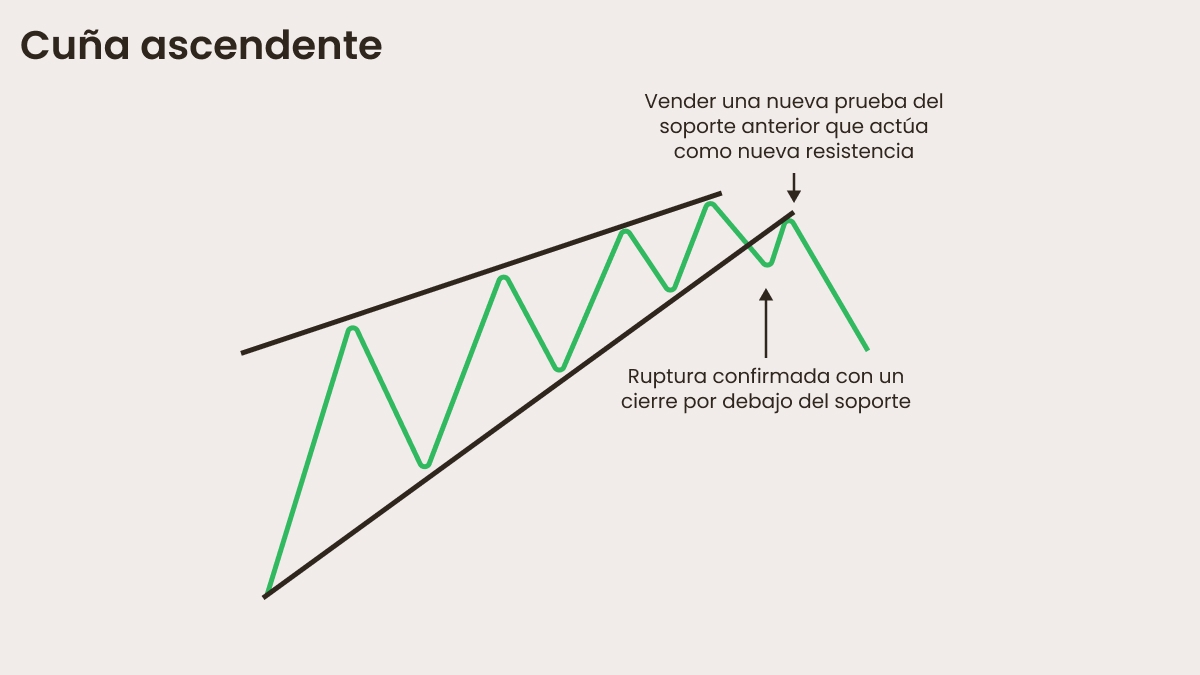
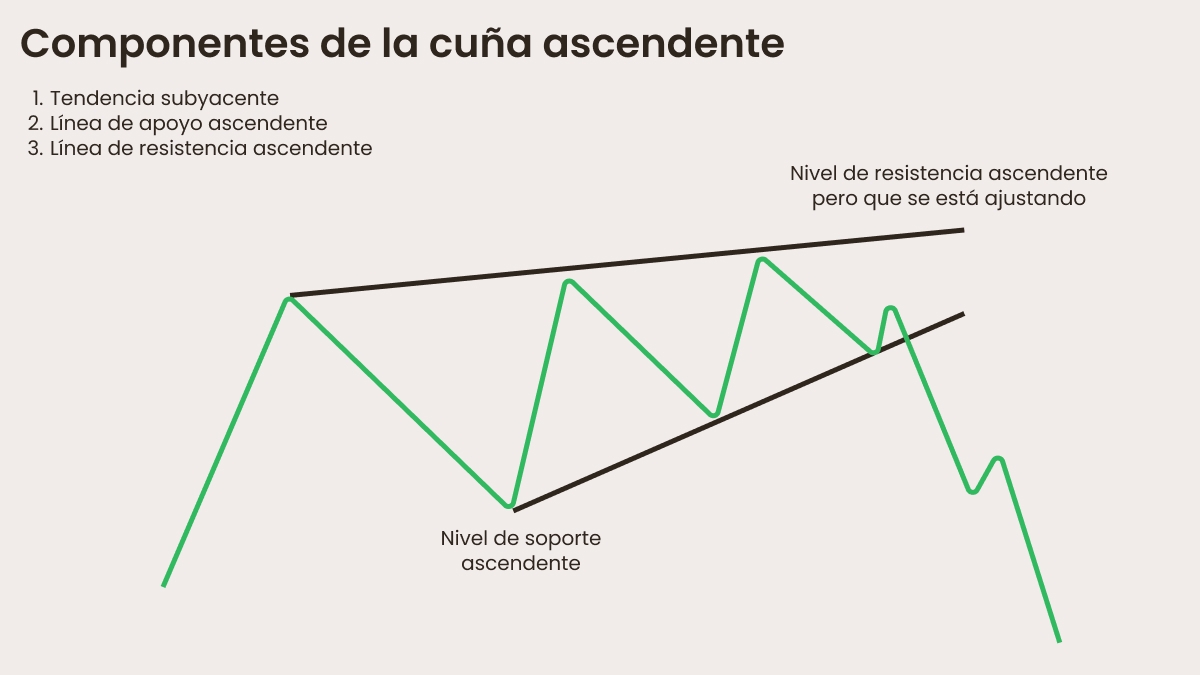
Se forma cuando el movimiento del precio comienza a estrecharse, creando dos líneas de tendencia ascendentes que convergen a lo largo del tiempo, lo que señala que el rango de precios se está contrayendo. La línea de tendencia inferior representa el soporte creciente, mientras que la línea de tendencia superior actúa como resistencia. Ten en cuenta que la pendiente de la línea de soporte es más pronunciada que la línea de resistencia, mostrando un desaceleramiento en el impulso.
Comportamiento del volumen
Esta contracción de la acción del precio indica un desbalance en el sentimiento del mercado: la presión de compra está comenzando a disminuir y las fuerzas de venta empiezan a tomar control. Una ruptura por debajo de la línea de tendencia de soporte suele ir acompañada de un aumento en el volumen, que confirma el movimiento bajista.
Dirección de ruptura
El precio se está moviendo hacia arriba dentro de la cuña, lo que puede parecer confuso ya que el patrón se considera bajista. Eso es porque a menudo conduce a una ruptura bajista. Una ruptura por debajo de la línea de tendencia inferior sugiere que los vendedores están tomando el control. Por lo tanto, independientemente del tipo (reversión o continuación), las cuñas alcistas son bajistas.
Temporalidad y ocurrencia
Las cuñas ascendentes pueden formarse en cualquier temporalidad (de minutos a semanas). Suelen aparecer después de una tendencia alcista, actuando como un patrón de reversión, una advertencia para los traders de un probable cambio a la baja. Sin embargo, también pueden formarse dentro de una tendencia bajista: si los precios comienzan a caer después de un corto rebote, esto indica un patrón de continuación antes de nuevas caídas.
Confirmación del patrón
Una ruptura válida suele ocurrir cuando el precio cierra por debajo de la línea de tendencia inferior con un fuerte impulso bajista. Puede que desees buscar una confirmación adicional, como un cruce de medias móviles, formaciones de velas bajistas o divergencia del RSI.
Ejemplo de un patrón de cuña ascendente
Imagina que una acción está en una tendencia alcista: sube de 50 USD a 80 USD en algunas semanas.
Durante este período, el precio se mueve dentro de un embudo ascendente en contracción, mientras el volumen disminuye y los compradores dudan en comprar a niveles más altos. El indicador RSI comienza a mostrar divergencia bajista: el precio hace máximos más altos, pero el RSI hace máximos más bajos. Eventualmente, el precio cae por debajo de la línea de tendencia inferior en 75 USD y lleva a una fuerte disminución a 65 USD.
Entonces, ¿cuál es la estrategia de trading cuando se produce un patrón de cuña ascendente?
Estrategia de trading en pocas palabras
Entrada después de una ruptura confirmada por debajo de la línea de tendencia de soporte.
Coloca una orden stop loss por encima del último swing alto dentro de la cuña.
Tu objetivo se mide por la altura de la cuña proyectada hacia abajo desde el punto de ruptura.
Domina el patrón de cuña ascendente y mejora tus predicciones de mercado. Opera con FBS.