Etapas de una tendencia
Lo siguiente importante es que cada tendencia se compone de 4 etapas:
Tendencia joven.
Tendencia madura.
Tendencia en envejecimiento.
Tendencia invertida.
Si una tendencia ya está envejeciendo, no tiene sentido buscar operar con ella. El objetivo es captar una tendencia en su inicio o durante la etapa temprana de su madurez. De esta manera podrás obtener una buena ganancia al operar con la tendencia.

Deberías estar buscando la etapa 2. En este punto, podrás trazar líneas de tendencia. Para una tendencia alcista, necesitarás al menos 2 mínimos: el mínimo inicial y el mínimo más alto. Si tienes 3 mínimos para conectar, aún mejor: significa que realmente se formó una tendencia. La línea de tendencia será una línea de soporte. Para una tendencia bajista, necesitarás al menos 2 máximos: el primer máximo y el segundo, un máximo más bajo. Como antes, sería aún mejor conectar 3 máximos. En este caso, la línea de tendencia será una línea de resistencia.
Es muy importante que no te demores en hacer el esfuerzo de trazar las líneas de tendencia. Representan una herramienta simple pero eficiente de análisis de gráficos. No solo ayudarán a encontrar las áreas donde el precio puede rebotar desde su soporte o resistencia, sino que también mostrarán cuán fuerte es la tendencia. Considera esta observación: cuanto más empinada sea la línea de tendencia, mayores son las posibilidades de que el precio la atraviese. Si el precio sube rápidamente, los compradores que lo empujan más alto pronto se quedarán sin fuerza, y el mercado se revertirá. Si deseas elegir una buena tendencia que dure mucho tiempo, elige una con líneas de tendencia que sean menos pronunciadas.
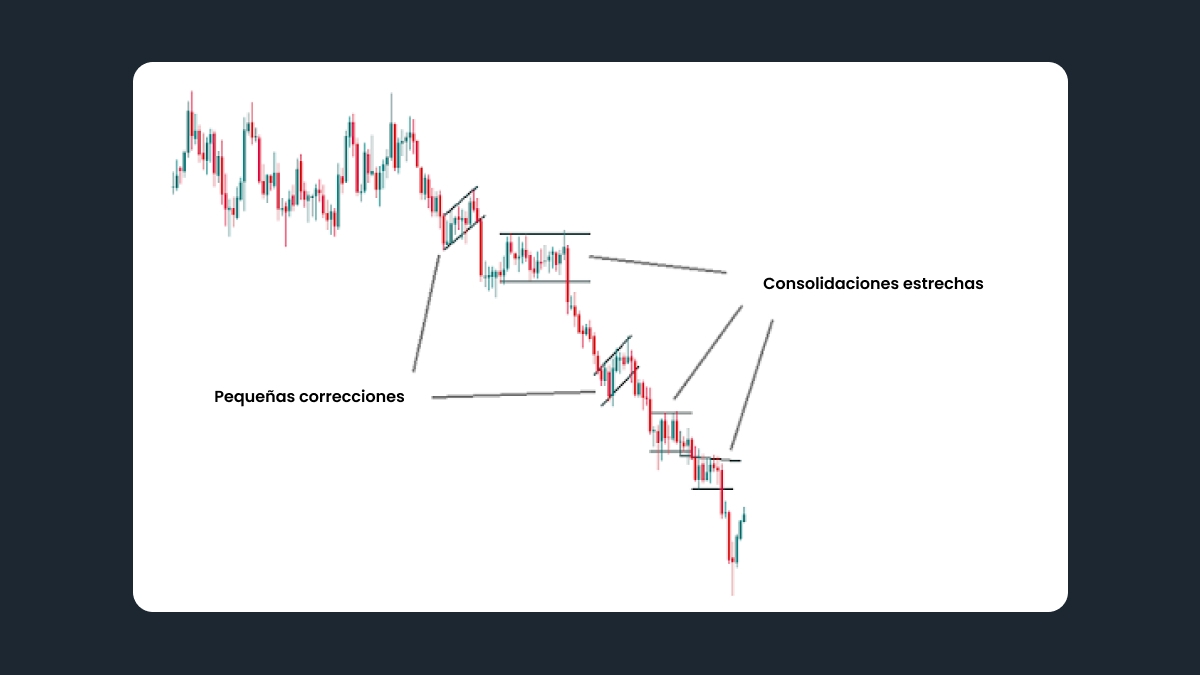
También te aconsejamos que revises las correcciones y consolidaciones que ocurren durante tus tendencias. Como puedes ver, incluso cuando el precio tiende a subir o bajar, no lo hace de manera constante en línea recta todo el tiempo. Una corrección ocurre cuando un par de divisas retrocede en la dirección opuesta a la de la tendencia principal. Una consolidación es un período de movimiento de precios horizontal.
Si los períodos de movimientos en contra de la tendencia (correcciones) son cortos y los rangos laterales (consolidaciones) son estrechos, identificaste una tendencia fuerte y sólida que es segura para operar.
Indicadores técnicos
Hay un grupo de indicadores en MT4, llamados "indicadores de tendencia". Estos pueden ayudarte a aprovechar una tendencia.
La media móvil ayudará a identificar una tendencia alcista o bajista y actuará como soporte y resistencia. Recomendamos usar las medias móviles simples con periodos de 20, 50, 100 y 200.
AdX muestra la dirección y la fuerza de una tendencia. Las lecturas por encima de 30 indican una fuerte tendencia. Ten en cuenta que este indicador puede ser lento.
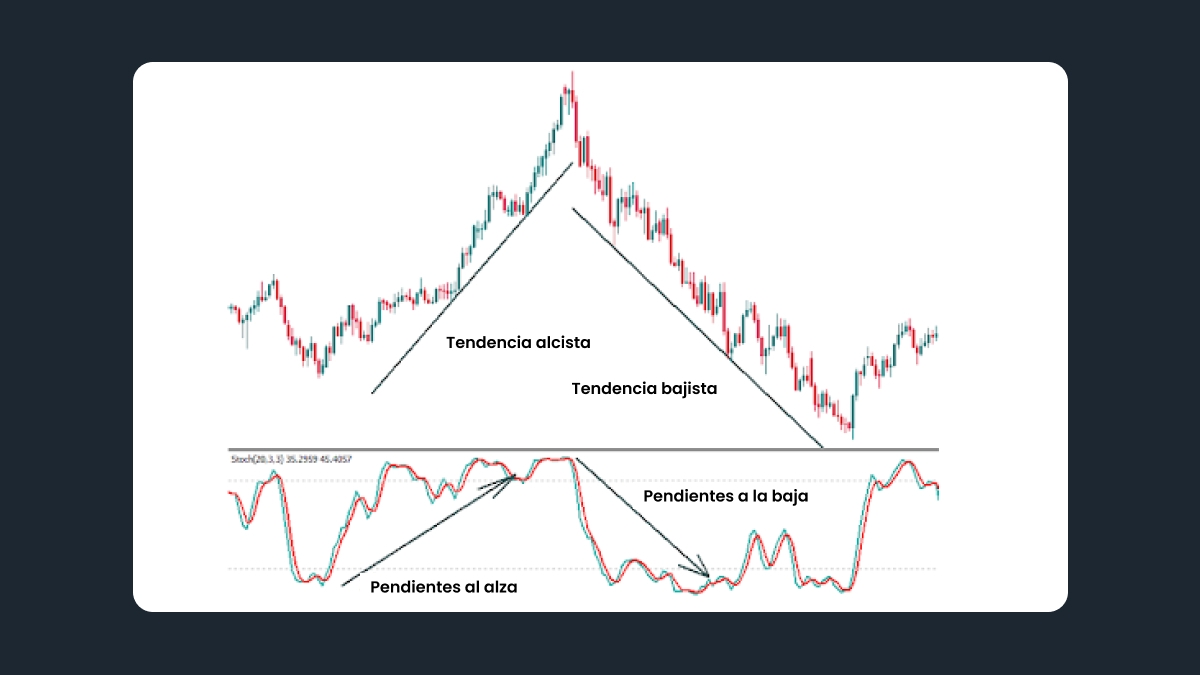
Los traders también pueden usar osciladores (indicadores que oscilan alrededor de algún valor central y se muestran en una ventana separada debajo del gráfico de precios). Después de haber determinado la dirección de la tendencia usando líneas de tendencia o medias móviles, verifica el oscilador estocástico. En una tendencia alcista, su pendiente debe ser fuertemente ascendente. En una tendencia bajista, el estocástico tiene que inclinarse de forma pronunciada hacia abajo. Si el precio está alcanzando nuevos máximos en una tendencia alcista, pero el estocástico no lo está, esto puede indicar un cambio hacia abajo.
Puedes obtener datos similares a los que proporciona el indicador estocástico de otro oscilador llamado MACD. La diferencia es que el MACD se presenta en forma de un histograma (columnas debajo del gráfico de precios). Durante una tendencia alcista, las columnas de MACD deberían hacerse más grandes, mientras que durante una tendencia bajista deberían reducirse y luego llegar a la zona negativa.
Estrategia para operar utilizando una tendencia
La mejor manera es seguir al mercado. Éstos son los principales pasos recomendados:
Determina cuánto tiempo quieres permanecer en la tendencia. Esta decisión influirá en las temporalidades que elijas para operar. Si decides operar intradía (es decir, solo durante varias horas), determina la tendencia en la temporalidad diaria. También puedes usar gráficos H4 y H1 para planificar tu operación. No recomendamos perder tiempo en temporalidades más pequeñas como M15, ya que la situación allí cambia demasiado rápido para hacer un buen análisis para una operación que estará abierta durante varias horas.
Identifica la tendencia: ¿es una tendencia alcista o una tendencia bajista? Revisa las noticias y análisis económicos, intenta comprender qué factores fundamentales (económicos) o noticias están detrás de esta tendencia. ¿Puede ser que el mercado esté anticipando un evento importante? ¿O tal vez ya sucedió algo y está teniendo un impacto en el mercado? Si el sentimiento del mercado es alcista, entonces puedes realizar una compra en una tendencia alcista. Si es bajista, puedes realizar una venta en una tendencia descendente.
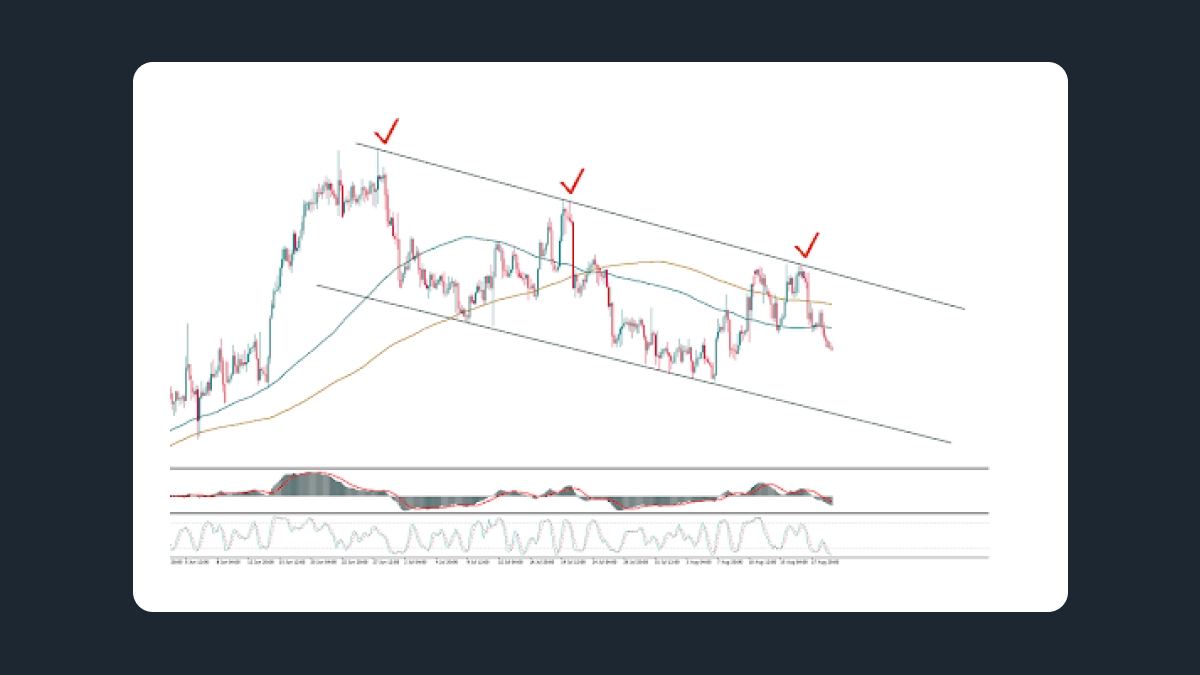
Dibuja líneas de tendencia. ¿Son empinadas o normales? ¿Cuántas veces probó el precio la línea de tendencia? Si el precio tocó la línea de soporte por tercera vez en una tendencia alcista y se recuperó durante una tendencia alcista, es una señal para compra.
Comprueba indicadores técnicos. Asegúrate de que confirmen la tendencia.
Determina la etapa de la tendencia. Operar al principio o al final de la tendencia es arriesgado, es mejor elegir una tendencia madura.
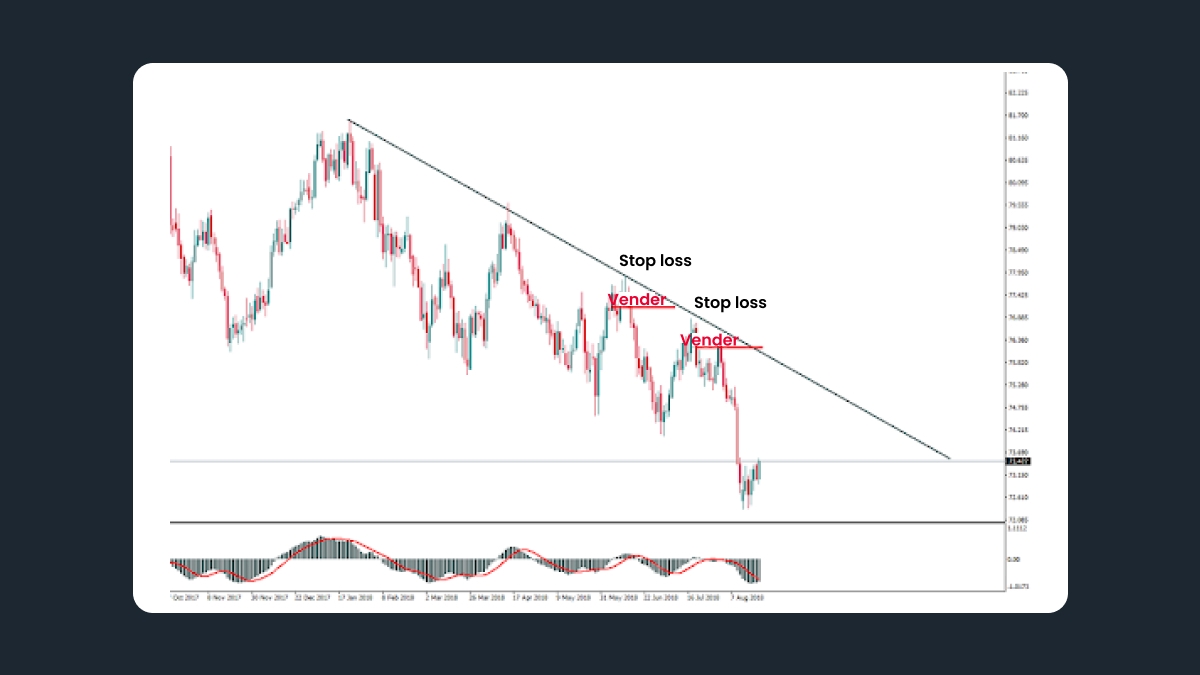
Coloca una orden limitada cerca de una línea de tendencia. En una tendencia alcista, coloca un buy limit en la línea de soporte. En una tendencia bajista, coloca un sell limit cerca de la línea de resistencia.
Coloca un stop loss protector al otro lado de la línea de tendencia. Tu stop loss no debería ser muy ajustado para que tu orden no se cierre simplemente debido a la volatilidad diaria. No hay una solución universal para elegir un stop loss. Mucho dependerá de cuánto tiempo planees mantener la operación (debes tener una idea de dónde cerrarás tu operación con ganancia) y del tamaño de la operación. Por lo general, un stop loss es aproximadamente 1/3 del take profit potencial. En resumen, para una operación intradía de varias horas, es mejor tener un stop loss que exceda los 15 pips.