XBRUSD, H4
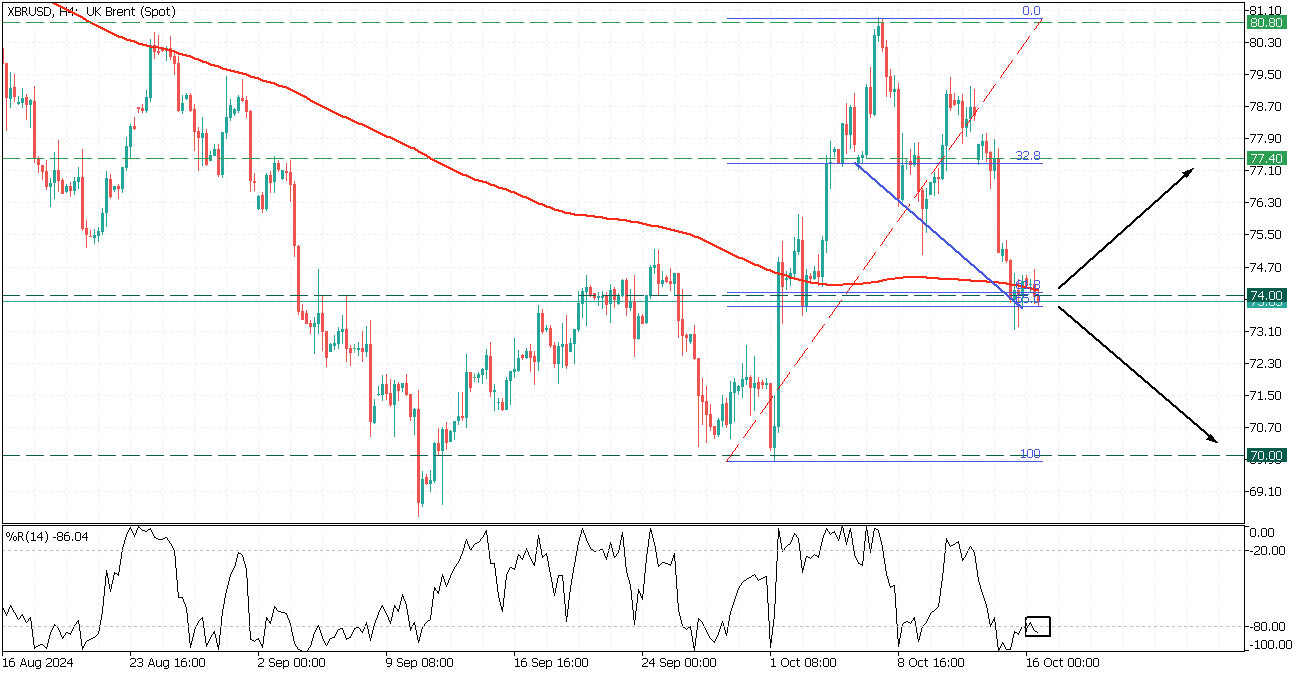
On the H4 timeframe, XBRUSD navigates within a trendline and faces the 74.00 support, aligned with the golden Fibonacci pocket.
%R oscillator is on the oversold zone, giving a potential bullish signal, however, the 200-MA giving a strong resistance for the asset. This set up gives us a mixed sentiment;
- If the price breaks above the 200-MA resistance it will rise to 77.40 and the 32.8 Fibonacci;
- Breaching below the 74.00 support will lead to a decline to 70.00 level.