Fundamental Analysis
The price of WTI, the benchmark for US crude, dropped to $68.55 due to progress in a potential ceasefire agreement between Israel and Hezbollah, which could reduce geopolitical risk in the Middle East. Despite this decline, tensions in Ukraine, with threats from Russia regarding the use of nuclear weapons and the drop in its seaborne crude exports, could limit further price decreases.
Brent crude, the global oil benchmark, is trading near $73.04, influenced by a meeting between Iraq, Russia, and Saudi Arabia to discuss the energy market ahead of the OPEC+ gathering. These discussions, coupled with the reduction in Russian crude flows to India, generate expectations of production adjustments to balance supply. Additionally, the OPEC+ meeting on Sunday could be crucial for defining production normalization strategies through 2025, within a context of moderate oil price recovery amid global trade and political tensions.
Technical Analysis
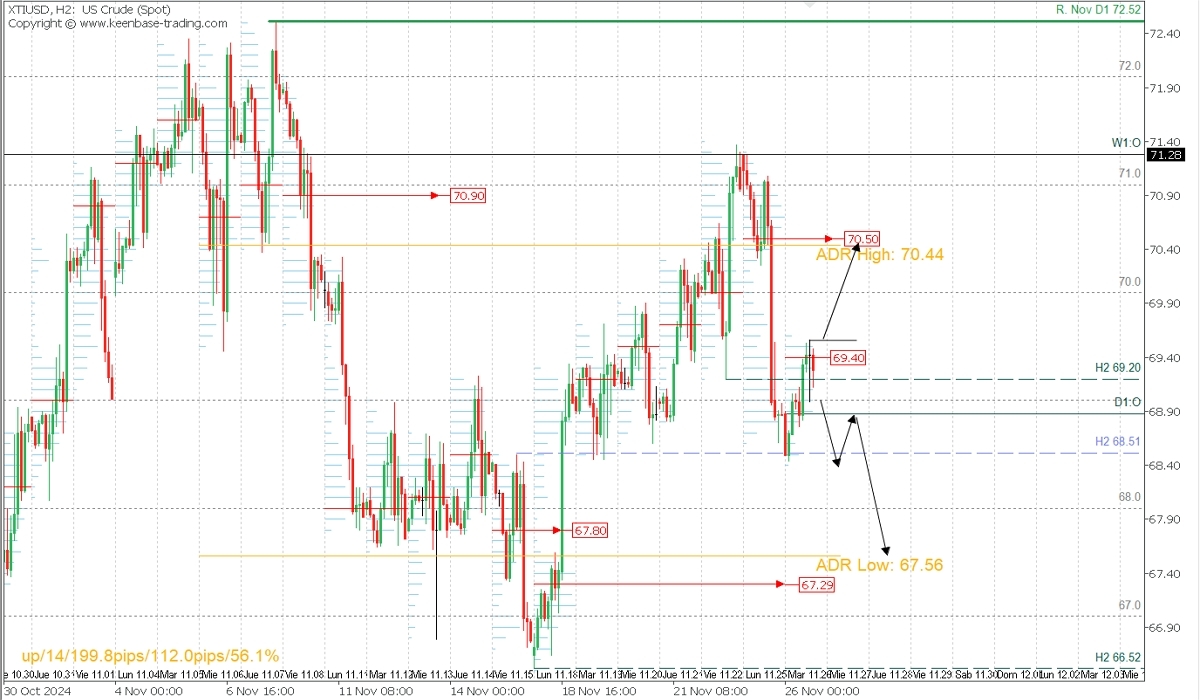
XTIUSD, H2

- Supply Zones (Sell): 69.40 and 70.50
- Demand Zones (Buy): 67.80 and 67.29
The price has fallen below the last validated support of the most recent bullish correction at 69.20, retracing toward the broken level. This creates a scenario for a bearish continuation after forming a volume concentration of around 69.40.
This volume concentration will act as a supply zone if the price decisively moves below it, serving as resistance. Conversely, if the price moves above it, it will act as a support and a buying zone.
Selling below 69.40 targets intraday levels of 68.49, 68.00, 67.80, and the next demand zone between 67.56 and 67.29, paving the way for continued bearish momentum in the coming days. Alternatively, a broader pullback above 69.40 could seek liquidity in yesterday’s last supply zone near 70.50, which may reignite selling toward 67.00 in the coming days.
This bearish scenario will be invalidated if the price rebound breaks above the week’s opening at 71.28, which also represents the last key resistance level.
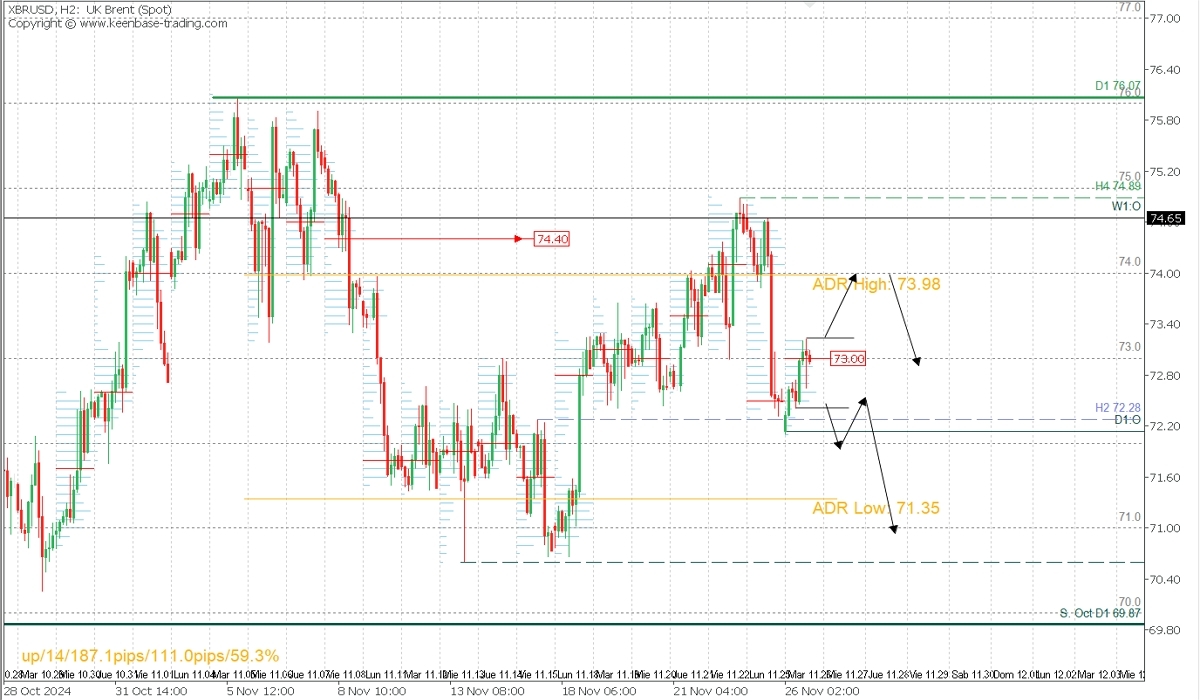
XBRUSD, H2

- Supply Zones (Sell): 74.30 and 73.00
- Demand Zones (Buy): 71.20
Similar to the technical structure of WTI, Brent could continue selling below the volume concentration formed around 73.00, with targets at 72.00 and the day’s average bearish range at 71.35.
On the other hand, breaking above the indicated volume concentration would allow a rebound toward yesterday’s supply zone of around 74.00, offering a better price for selling. Intraday targets include 72.00 and 71.90, with potential for weekly selling toward 71.00 and support at 70.60.
This bearish scenario will be invalidated if the price rebound breaks above the week’s opening at 74.65 and the next resistance at 74.89.
Always wait for the formation and confirmation of an Exhaustion/Reversal Pattern (ERP) on the M5 chart, as explained here https://t.me/spanishfbs/2258, before entering trades at the key zones indicated.
Uncovered POC Explanation:
POC = Point of Control: This is the level or zone where the highest volume concentration occurred. If this level previously triggered a bearish move, it is considered a selling zone, forming resistance. Conversely, if it triggered a bullish impulse, it is considered a buying zone, often located at lows, forming support areas.
@2x.png?quality=90)


