FBS turns 16

Unlock birthday rewards: from gadgets and dreams cars to VIP trips.Learn more
Open account
Open accountLog In
Open account

May 12, 2025

Stocks

US100 Soars Over 4% After US-China Tariff Truce

Fundamental Analysis

The surprising 90-day trade truce between the U.S. and China was met with enthusiasm across U.S. stock markets, triggering an immediate rotation into risk assets. The partial tariff reductions on both sides have eased global slowdown fears and fueled expectations of economic continuity and corporate stability. Reflecting this renewed optimism, the tech-heavy US100 (Nasdaq 100) led the rally with a gain of over 4%, marking its strongest intraday performance in weeks, followed by solid advances in the SP500 and Dow Jones.

Investors interpret the deal as a signal that the threat of a prolonged trade war is easing, supporting valuations in the tech sector, which is particularly sensitive to international supply chains. The prospect of ongoing negotiations, with no signs of a complete breakdown, keeps risk appetite alive—especially in companies with significant exposure to China. However, markets are now shifting their focus to Tuesday’s key inflation data, as a hotter-than-expected CPI print could reignite concerns over U.S. monetary tightening and temporarily cap the current bullish momentum.

Technical Analysis

US100 | H4

US100.jpg
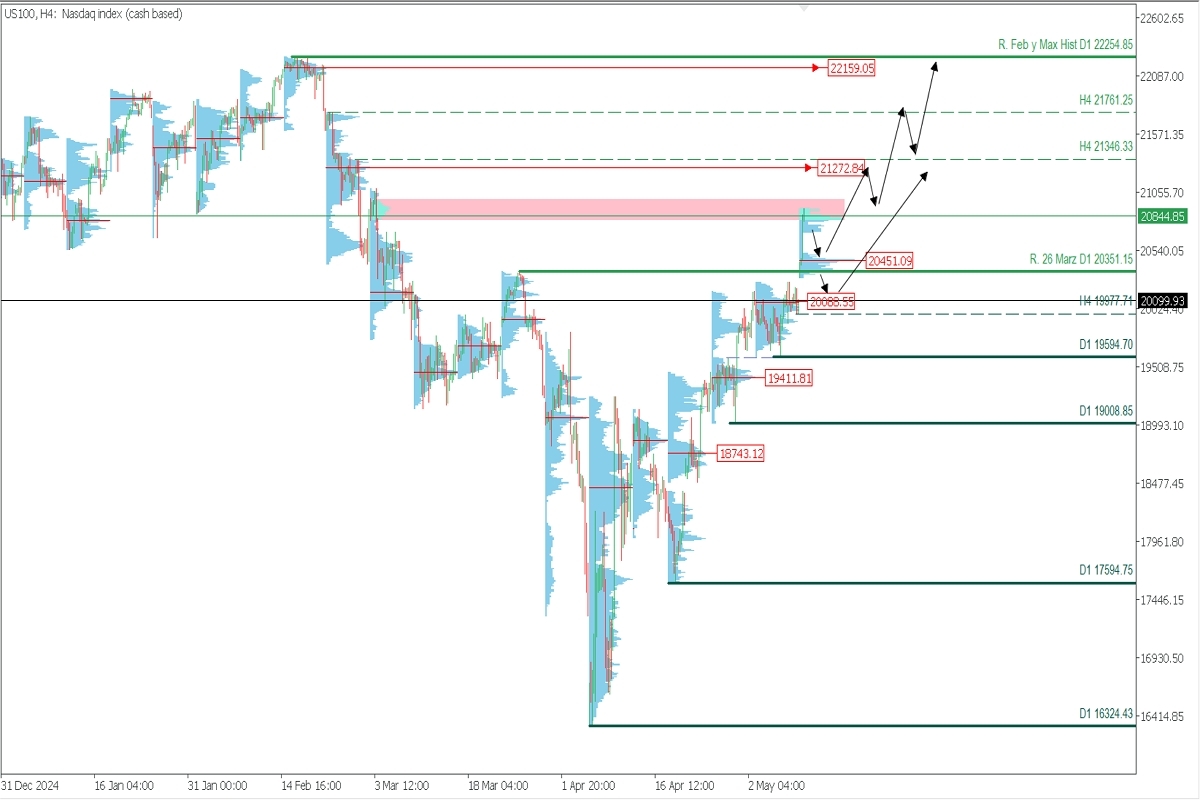
  • Supply Zones: 20845, 21273, 22159
  • Demand Zones: 20451, 20088, 19411.81

U.S. indices kicked off the week with optimism, gapping above the last macro daily resistance from March 26 at 20351.15. This was fueled by initial tariff agreement headlines between China and the U.S., triggering more than a 4% rally in the Nasdaq 100 and its derivative, the US100, during the European session.
This surge brought the price up to a key February sell-side volume node around 20845, from where a pullback toward the current demand zone near 20451 is expected. This move also activated 19977.71 as the last validated intraday support—our key reference for the continuation of the current bullish bias.
Buy setups may resume from this demand area, targeting the unfilled POC at 21272.84, and, upon a confirmed breakout, extend further to 21761.25 and 22159.

Technical Summary

  • Bearish Scenario: Sell below 20844 → target 20455 → watch for bullish reentry from demand zone.
  • Bullish Scenario: Buy above 20451 after correction → targets: 21272, 21346, 21761, 22159.

📌 Exhaustion/Reversal Pattern (ERP): Always wait for the confirmation of an ERP on M5 before entering trades at key zones (examples here 👉 https://t.me/spanishfbs/2258).

📌 Unfilled POC (Point of Control): The level with the highest volume concentration. If followed by a bearish move, it's resistance. If followed by a bullish move, it becomes support.

Trading foreign currencies on margin involves significant risks and may not be suitable for everyone, as high leverage can increase both potential gains and losses. Before entering the foreign exchange market, it is essential to evaluate your investment goals, personal experience, and risk tolerance.

Share with friends:
Tibisay Ramos

Author: Tibisay Ramos

Open an FBS account

By registering, you accept FBS Customer Agreement conditions and FBS Privacy Policy and assume all risks inherent with trading operations on the world financial markets.

More related articles

Apr 29, 2025

11:45

US100: Key Data, COT Positioning and Technical Levels

Stocks

Apr 22, 2025

10:36

U.S. Futures Rebound After Trump-Powell Clash Shakes Markets (April 22nd)

Stocks

Apr 22, 2025

10:10

Netflix Ahead of Earnings: A Defensive Opportunity in Times of Chaos?

Stocks

Apr 16, 2025

11:33

US100: Bearish Continuation Scenario (April 16th)

Stocks

FBS at social media

iconhover iconiconhover iconiconhover iconiconhover icon

Contact us

iconhover iconiconhover iconiconhover iconiconhover icon
store iconstore icon
Get on the
Google Play

Trading

Company

About FBS

Legal documents

Company news

FC Leicester City

Help Center

Partnership programs

The website is operated by FBS Markets Inc.; Registration No. 000001317; FBS Markets Inc. is registered by the Financial Services Commission under the Securities Industry Act 2021, license number 000102/31. Office Address: 9725, Fabers Road Extension, Unit 1, Belize City, Belize.

FBS Markets Inc. does not offer financial services to residents of certain jurisdictions, including, but not limited to: the USA, the EU, the UK, Israel, the Islamic Republic of Iran, Myanmar.

Payment transactions are managed by HDC Technologies Ltd.; Registration No. HE 370778; Legal address: Arch. Makariou III & Vyronos, P. Lordos Center, Block B, Office 203, Limassol, Cyprus. Additional address: Office 267, Irene Court, Corner Rigenas and 28th October street, Agia Triada, 3035, Limassol, Cyprus.

Contact number: +357 22 010970; additional number: +501 611 0594.

For cooperation, please contact us via [email protected].

Risk Warning: Before you start trading, you should completely understand the risks involved with the currency market and trading on margin, and you should be aware of your level of experience.

Any copying, reproduction, republication, as well as on the Internet resources of any materials from this website is possible only upon written permission.

The information on this website does not constitute investment advice, a recommendation, or a solicitation to engage in any investment activity.