Fundamental Analysis
On Tuesday, April 15, 2025, the US dollar extended its weakness against the euro due to several key factors. President Trump’s unpredictable trade policies, including new tariffs on Chinese tech products, created uncertainty in global markets and weakened confidence in the dollar as a haven. Additionally, European rating agency Scope warned of a potential downgrade of the US credit rating if trade tensions continue, which could further erode global trust in the dollar. At the same time, falling US Treasury yields and volatility in the bond market reflected growing risk aversion among investors, who are seeking shelter in assets like gold, which reached new all-time highs.
What Does the COT Report Tell Us?
The COT (Commitments of Traders) report is a weekly publication by the CFTC that shows the net positions of major players in the futures markets. Retail traders focus particularly on the positions of non-commercial traders (institutions and large funds), as they tend to drive market direction. Last week, speculators became aggressive net sellers of the US dollar, reducing long positions and increasing short positions, marking the most bearish stance on the dollar in the past six months. At the same time, net speculative long positions on the euro increased, signalling bullish sentiment. This divergence suggests that institutional traders expect further appreciation of the euro against the dollar, which supports long strategies on EURUSD.
Technical Analysis | EURUSD, H4
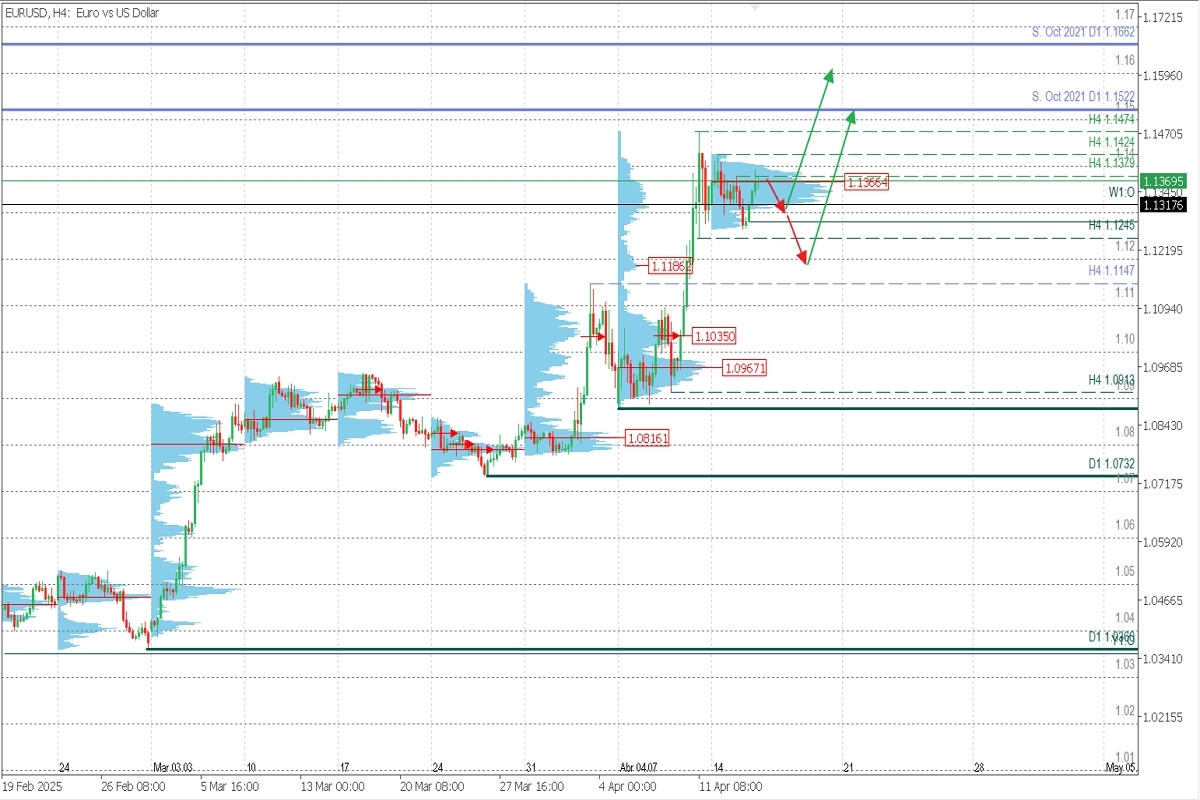
Supply Zone (Sell): 1.1522
Demand Zones (Buy): 1.1186 | 1.1035 | 1.0967
Price Action
The technical structure remains bullish, with the last validated support on H4 at 1.0913. This is the most recent key level confirming the trend’s continuation.
Volume Profile
Weekly volume profiles show the latest demand zone around 1.0967, while smaller buy volume nodes at 1.1035 and 1.1186 also act as important support levels. Based on three full trading days, the current week’s volume POC (Point of Control) can begin to be considered from Wednesday and is forming around 1.1366.
Technical Setup
Price is currently breaking above the last resistance of the correction at 1.1379 — a first sign of bullish continuation. A retracement of about 1/3 or 50% toward 1.1320 would offer a favourable entry for new long positions targeting 1.14 and beyond. However, this breakout may become a trap (false breakout) if the price drops sharply below 1.1366 and extends lower toward 1.1245. That would indicate a broader bearish correction, possibly seeking liquidity at nearby demand zones like 1.12 and 1.1147, where new buyers could step in to prevent further decline.
Technical Summary
Main bullish scenario: Buy from 1.1320 with targets at 1.1424, 1.1474, and 1.1522 (October’s broken support now acting as resistance).
Bearish scenario: Sell below 1.1366, targeting 1.1317 and extending toward 1.13 and 1.1245. A confirmed break of 1.1245 would open deeper downside toward 1.12 and 1.1186.
Trading Tips
Exhaustion/Reversal Pattern (PAR):
Before entering any position at key zones, always wait for confirmation of a PER (Pattern of Exhaustion or Reversal) on the M5 chart. Learn how to identify it here.
POC (Point of Control):
The POC is the level with the highest volume concentration. If a bearish move started from that area, it acts as resistance. If a bullish impulse came from it, the zone acts as support.
