XAUUSD, H4
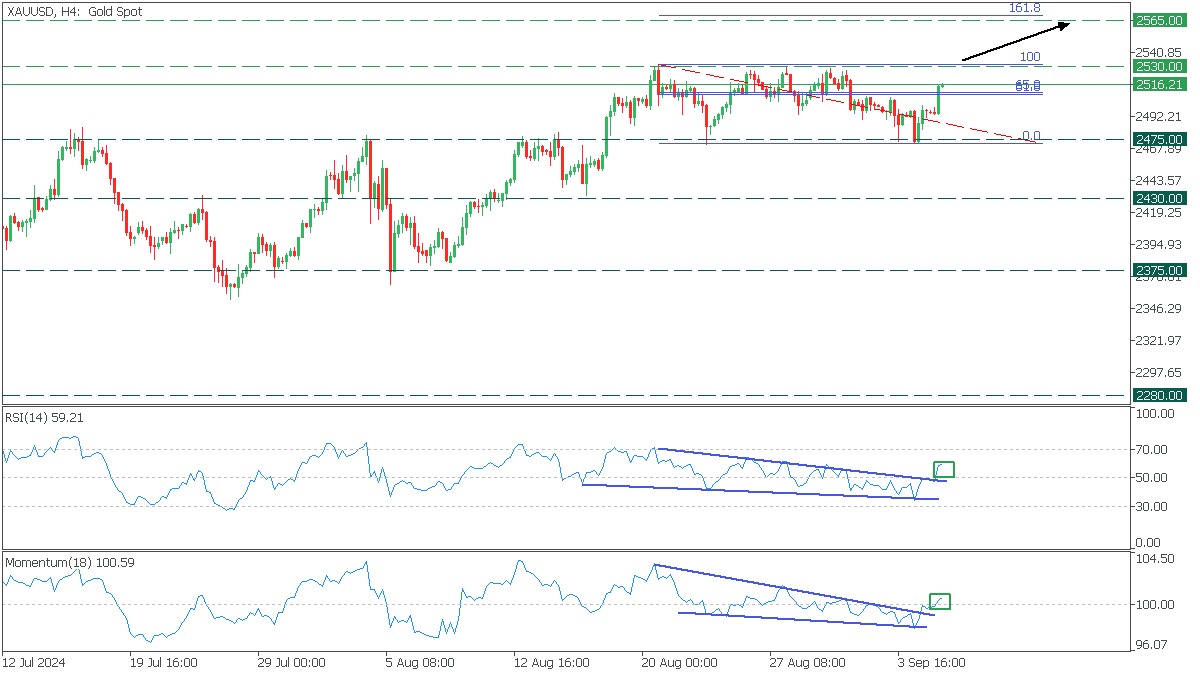
On the H4 timeframe, XAUUSD is showing a solid rise and approaching the 2530 resistance level. RSI and Momentum oscillators have broken above their falling wedge formations and crossed their middle lines upward, suggesting potential bullish momentum.
- If the price breaks above the 2530 resistance, it will open the way for a rise to the 2565, coinciding with the 161.8 Fibonacci ratio;
XAUUSD, Daily
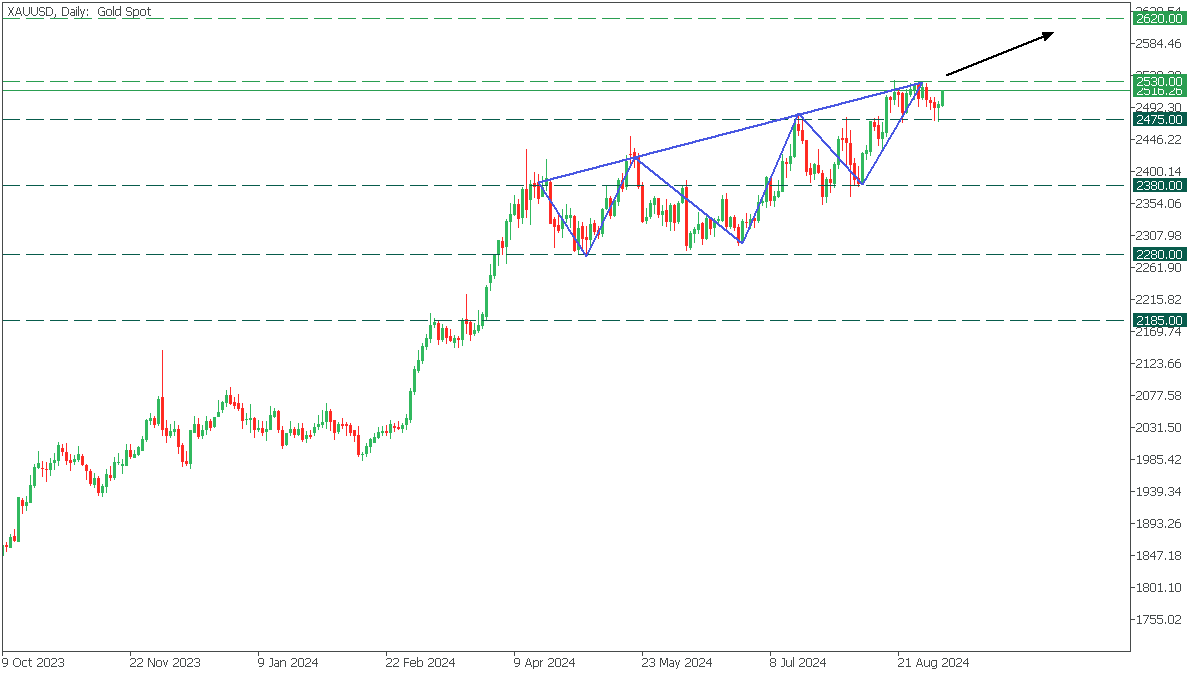
On the Daily timeframe, XAUUSD has formed an inverted head-and-shoulders pattern, targeting the critical resistance level of 2530 resistance.
- On the long-term forecast, If the price breaks above the 2530 resistance, it can skyrocket the gold to 2620 resistance, and bring in about 9000 profit pips!