XRPUSD – H4 Timeframe
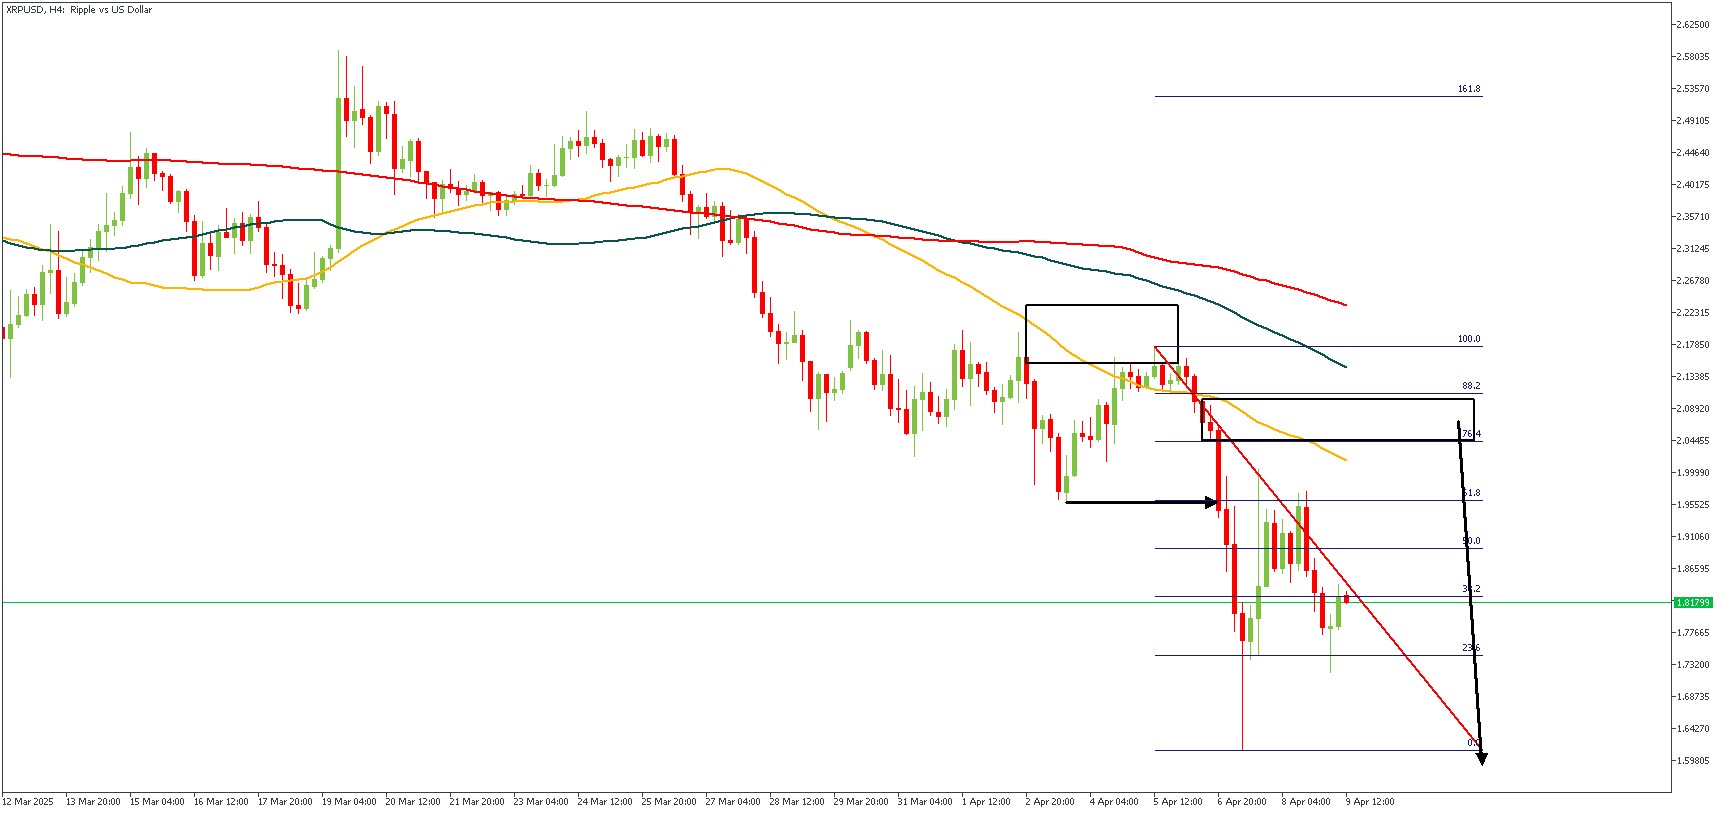
The crypto markets have been on a bearish rampage in the past couple of days primarily due to the uncertainty created in the financial markets by the ongoing tariff wars and the rapidly declining faith of investors in the future of the cryptocurrency markets. The price action on the 4-hour timeframe chart of XRPUSD tells the story. We see the 50, 100, and 200-period moving averages arrayed in a clear bearish manner, with the previous bearish impulse licking off from the rejection at the 50-period moving average resistance. A supply zone has been highlighted, serving as the area of interest for a bearish continuation entry.
XRPUSD – H2 Timeframe
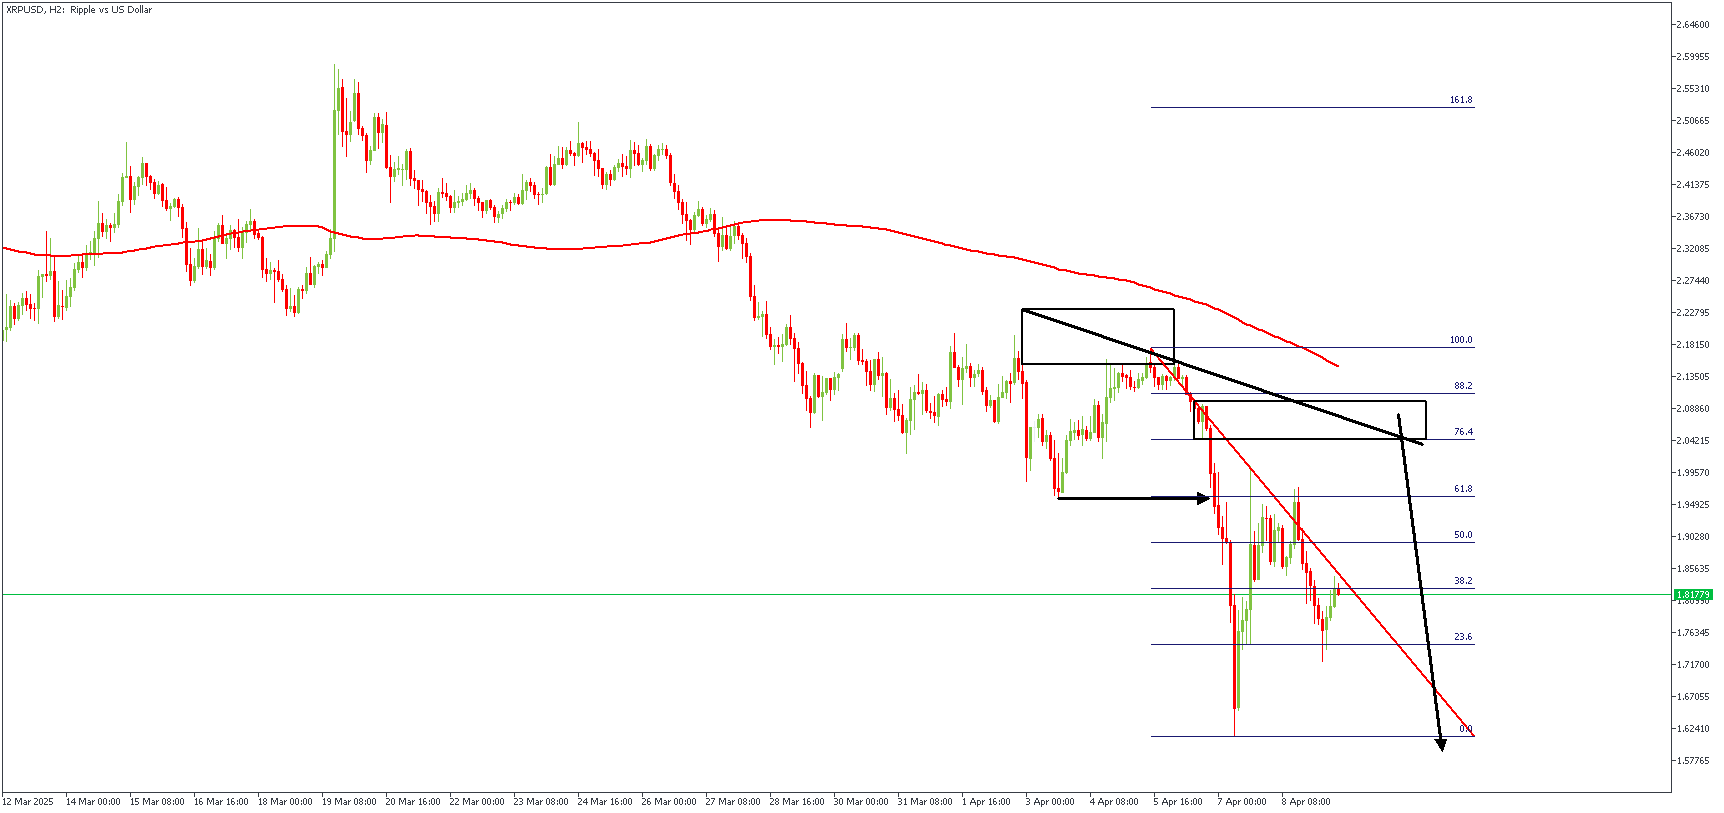
On the 2-hour timeframe chart, we see that the supply zone created by the previous bearish impulse has been highlighted. It falls between the 76% and 88% Fibonacci retracement levels, with additional confluence from the FVG, the buy-side liquidity, the trendline, and moving average resistance. The sentiment here is clear—bearish.
Analyst’s Expectations:
Direction: Bearish
Target- 1.57617
Invalidation- 2.23621
CONCLUSION
You can access more trade ideas and prompt market updates on the telegram channel.


