Currency Indices
Before trading any yen cross, always analyze the JPY separately as a haven and compare it with the index of the other currency involved. It’s essential to review each currency’s index to understand market sentiment and trade in line with the Primary Trend. For the yen, it’s useful to check the JPY Index versus the USD Index on TradingView:
The JPY Index reflects bullish sentiment, while the USD Index shows strong selling pressure. This suggests a bearish bias for the USDJPY pair. Any bullish movements for the USD will likely be short-lived unless a technical trend reversal is confirmed.
Fundamental Analysis
The Japanese yen (JPY) remains strong as a safe-haven asset amid escalating trade tensions between the U.S. and China. After Trump imposed new tariffs of 145%, China responded with 125% retaliatory tariffs. These geopolitical tensions are driving flows into the JPY, which is trading near its highest levels since September 2024. Additionally, optimism around a potential U.S.–Japan trade deal—fueled by encouraging comments from Trump and Treasury Secretary Scott Bessent—further supports the yen.
On the monetary policy front, divergence is putting downward pressure on USDJPY. The Bank of Japan (BoJ) maintains a hawkish stance following March’s 4.2% wholesale inflation data and wage pressure, while the Fed is expected to cut rates by 90 basis points in 2025 due to slowing inflation and the economic impact of tariffs. With the dollar at its lowest since April 2022, the pair continues in a multi-month downtrend, with risks skewed toward further USD weakness.
Key factors to monitor include the progress of U.S.–Japan trade talks, verbal interventions by Japanese officials regarding exchange rate volatility, and U.S. inflation and employment data to adjust Fed rate cut expectations.
Technical Analysis | USDJPY, H2
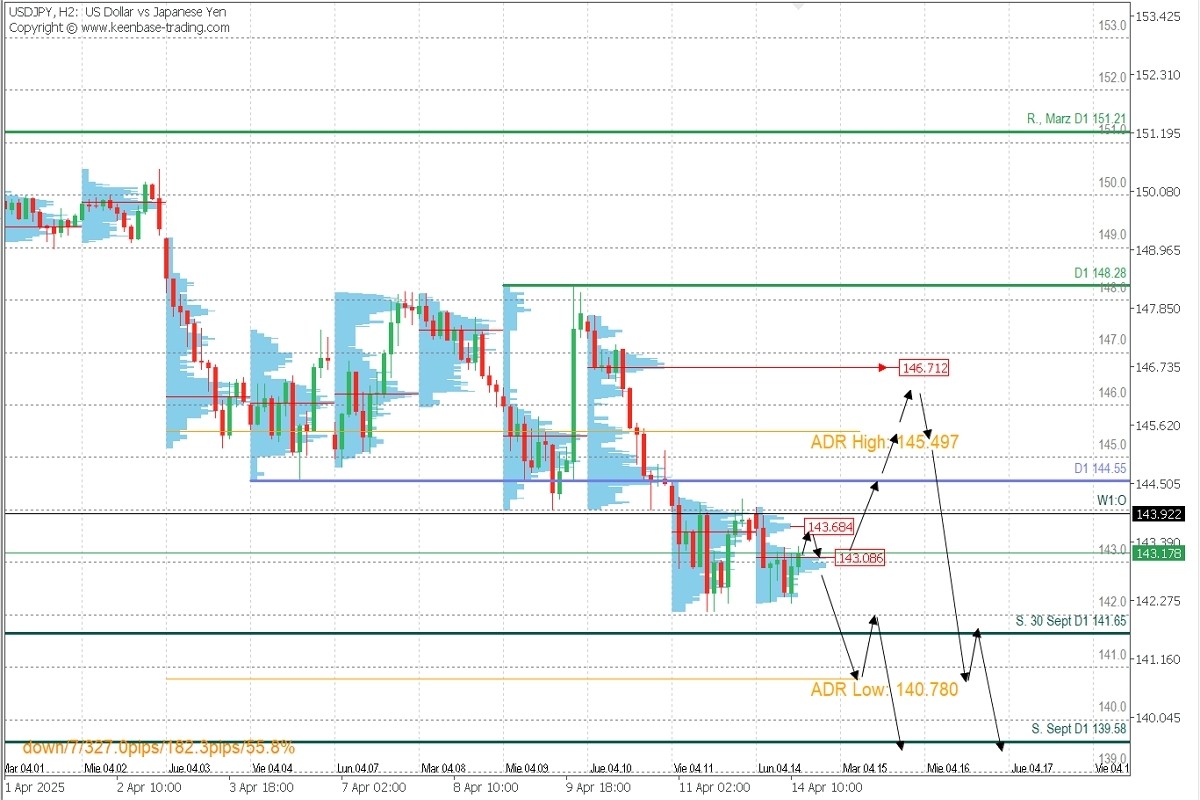
Supply Zones (Sell): 143.68, 144.55, 145.49, 146.71
Demand Zones (Buy): 142.00, 141.00
The pair is showing intraday consolidation with a volume concentration zone at 143.08, a potential buying area. If respected as support, it could fuel a correction toward 144.00, 144.55, and extend toward the average daily bullish range at 145.49, where swing shorts may resume targeting the September support at 139.58.
The anticipated bearish scenario will be activated if price breaks decisively below 143.00 (with full-bodied candles), opening the path toward the September 30 support and the average daily bearish range at 140.78.
Technical Summary
- Corrective bullish scenario: Buy positions above 143.00 or 144.00 with TPs at 144.55, 145.00, and 145.49, from where swing selling can resume targeting 142.00 and 141.00.
- Anticipated bearish scenario: Sell positions below 143.00 with TPs at 142.00, 141.00, and 140.00.
Check out the EURJPY trading idea.
Exhaustion/Reversal Pattern (ERP): Before entering any trade in the key zones mentioned above, always wait for the formation and confirmation of an ERP on the M5 timeframe, like the ones taught here 👉 https://t.me/spanishfbs/2258
Uncovered POC: POC = Point of Control. This is the level or zone with the highest volume concentration. If a bearish move followed it, it is considered a sell zone and acts as resistance. Conversely, if a bullish impulse followed it, it is considered a buy zone, usually found at lows, and forms support zones.


