Summary
- Key Level: Cash rate raised to 4.5% (effective May 5)
- Trend: AUD sees limited upside despite hawkish move
- Resistance Levels for AUDUSD:
- 0.6650 – immediate upside target
- 0.6700 – major resistance
- Support Levels:
- 0.6580 – initial support
- 0.6525 – lower bound (April lows)
AUDUSD initially lifted on the RBA decision but faces headwinds as investors price in a pause before further tightening.
Fundamental Drivers
- RBA Hikes Rates to Normal Levels
- Raised the cash rate by 25bps to 4.5%
- Sixth hike since October 2009 and now deemed "around average" by Governor Glenn Stevens
- Marks the end of emergency policy settings, shifting focus from normalization to possible restrictive policy ahead
- Inflation Stubbornly High
- Consumer Price Inflation (CPI) surged to 2.9% YoY in Q1 (up from 2.1%)
- Significant price gains in housing, education, and health sectors
- RBA upgraded its 2025 inflation forecast to ~2.75%, signaling persistent price pressures
- Economy Shows Firm Growth
- Strong terms of trade and rising income are expected to lift output growth in 2025
- Business credit is stabilizing, and lender confidence is improving, although housing credit growth is moderating due to higher borrowing costs.
- Future Rate Path Uncertain
- JP Morgan expects RBA to pause until July before possibly hiking again
- Westpac forecasts two more hikes in 2025 (August and November), driven by quarterly inflation readings staying sticky at 0.7%-0.9%
- Domestic Risks Emerging
- Higher mortgage costs are straining household budgets
- First home buyers are paying $317/month more than in late 2009, according to HIA estimates
- Rising rates may eventually weigh on consumption and housing activity, dampening AUD upside
Key Takeaway for Traders
- While the RBA's rate hike supports the Australian Dollar, the fact that the policy is now considered "normal" suggests a more cautious hiking pace ahead.
- AUDUSD may struggle to extend gains if domestic growth slows or global risk appetite weakens.
- Focus now shifts to Australian inflation data, global commodity prices, and RBA communications for clues about the timing of the next hike.
AUDUSD – H2 Timeframe
.png)
Price action on the 2-hour timeframe chart of AUDUSD is trading in a wedge pattern between a trendline support and a resistance trendline. Within this wedge pattern, however, we can see that an SBR (Sweep Break Retest) pattern has been formed along the trail of the trendline support. The highlighted demand zone matches perfectly with the confluence from the trendline support and the internal structure on the 2-hour timeframe chart.
AUDUSD – H1 Timeframe
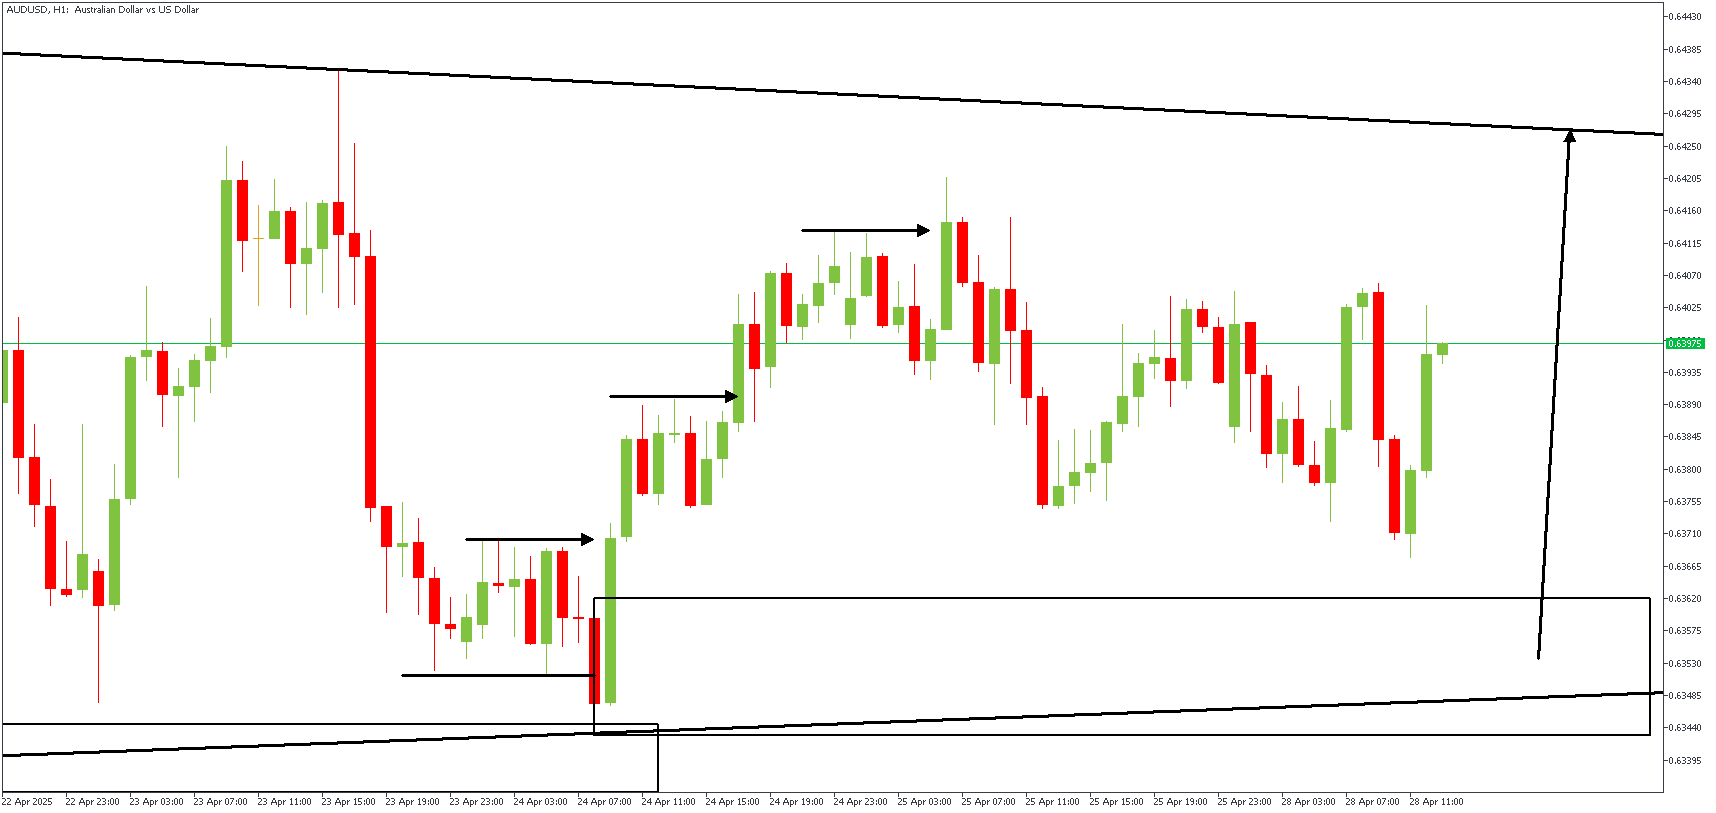
The 1-hour timeframe chart clarifies and details the SBR pattern, revealing a double break of structure, a Fair Value Gap, and a sweep of liquidity from equal lows. These conditions contribute to the possibility of a bullish outcome for price on the AUDUSD chart.
Analyst's Expectations:
Direction: Bullish
Target- 0.64280
Invalidation- 0.63328
CONCLUSION
You can access more trade ideas and prompt market updates on the telegram channel.


