Summary
- Current Price: ~$3,320
- Support Levels:
- $3,300: Key psychological level
- $3,288: 38.2% Fibonacci retracement
- $3,260: Recent swing low
- $3,225–$3,200: 50% Fibo & near-term top confirmation if broken
- Resistance Levels:
- $3,367–$3,368: 23.6% Fibo and key pivot
- $3,400: Round-number target
- $3,425–$3,427: Intermediate resistance
- $3,500: Major psychological ceiling
Gold has bounced after holding the 38.2% Fibo support at $3,288, but upward momentum is currently stalling at the $3,367–$3,368 zone. On the daily chart, oscillators remain bullish, suggesting further upside if $3,368 is reclaimed.
Fundamental Factors Affecting Gold
- Safe-Haven Demand Reignited
- Treasury Secretary Scott Bessent’s firm stance on China tariffs has dimmed hopes for a quick deal. This revives demand for gold as a hedge against policy unpredictability and global trade disruptions.
- Trump’s return to reciprocal tariffs rhetoric reinforces the narrative of prolonged trade tensions.
- Fed Policy Outlook Turning Dovish
- The Fed’s Beige Book pointed to slowing consumer demand, a cooling labor market, and business uncertainty.
- Markets now price in at least three Fed rate cuts by year-end, beginning in June, supporting gold’s non-yielding appeal.
- Mixed Economic Signals
- S&P Global’s PMI: Slowing service sector activity raises concerns about broader demand.
- Durable Goods and Jobless Claims (due today) may provide near-term direction.
- US Dollar Weakness
- The USD has pulled back modestly after a two-day recovery.
- A weaker dollar is gold-positive, reducing the opportunity cost of holding bullion for international investors.
- Tempered Risk Appetite
- Despite a general risk-on mood, uncertainty around Fed independence, tariffs, and global growth risks keep markets cautious.
- This limits risk asset upside and provides underlying support to gold.
Key Takeaway for Traders
- Bullish Bias Holds, but $3,368 is a key ceiling in the short term.
- Traders should watch for a clean break above $3,368 to target $3,400 and $3,425.
- Failure to hold $3,300–$3,288 opens the door to $3,260 and $3,225 on deeper correction.
- For Forex traders:
XAUUSD – H2 Timeframe
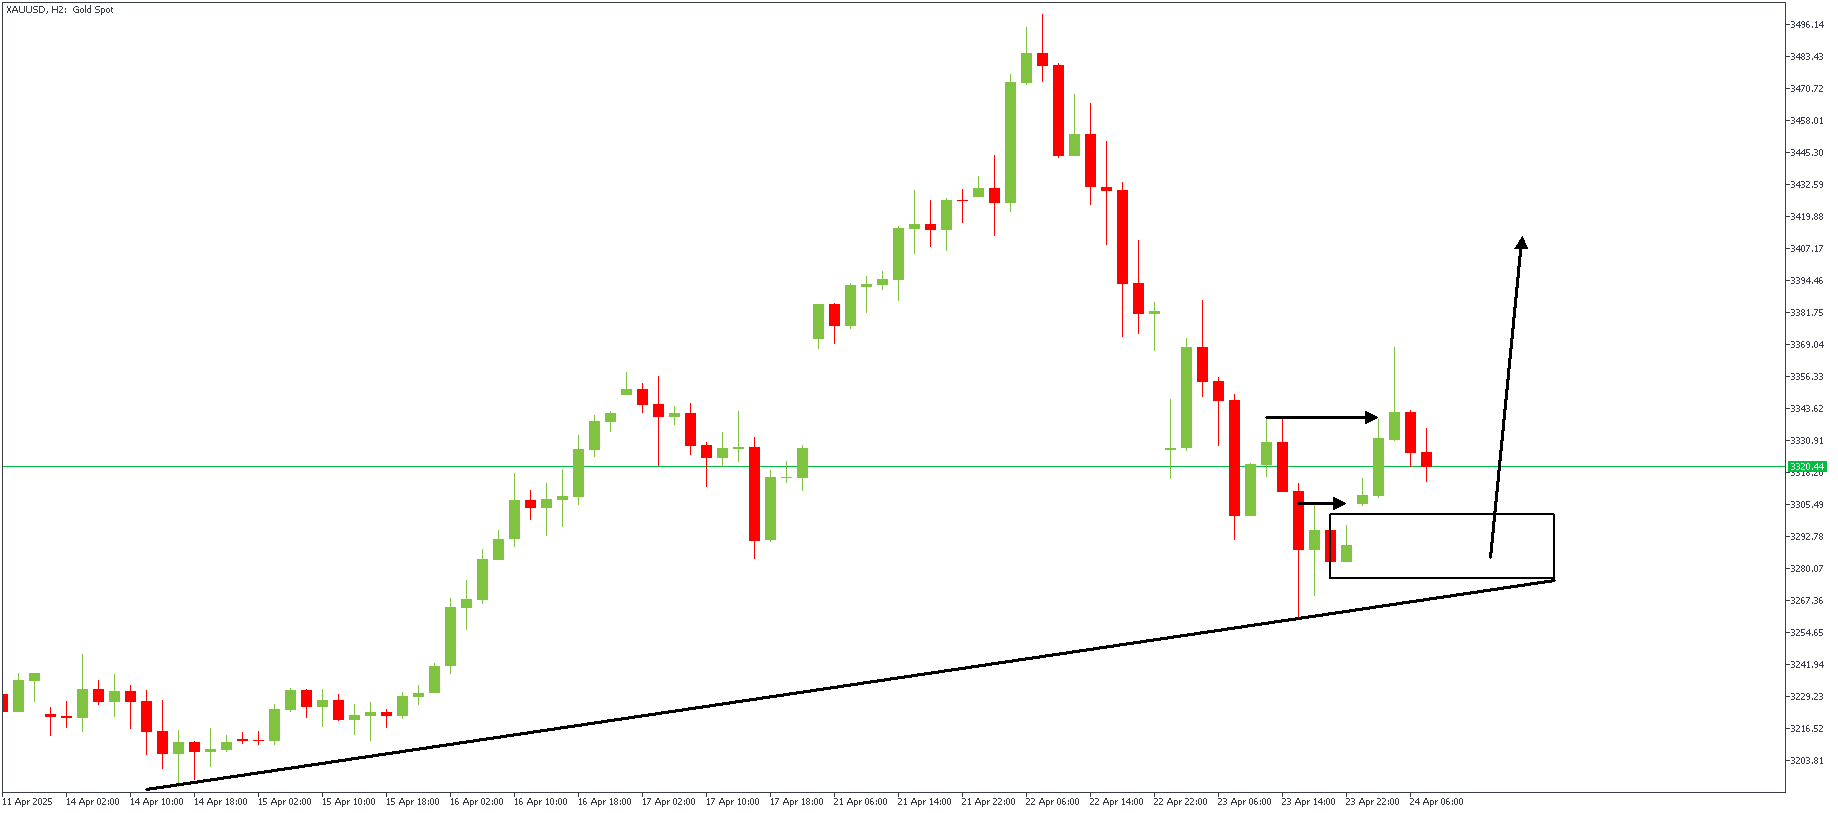
Reacting to the trendline support, the price action on the 2-hour timeframe chart of XAUUSD gave a bullish break of structure with a gap. This shows that we can expect a show of strength from the highlighted demand zone.
XAUUSD – H1 Timeframe
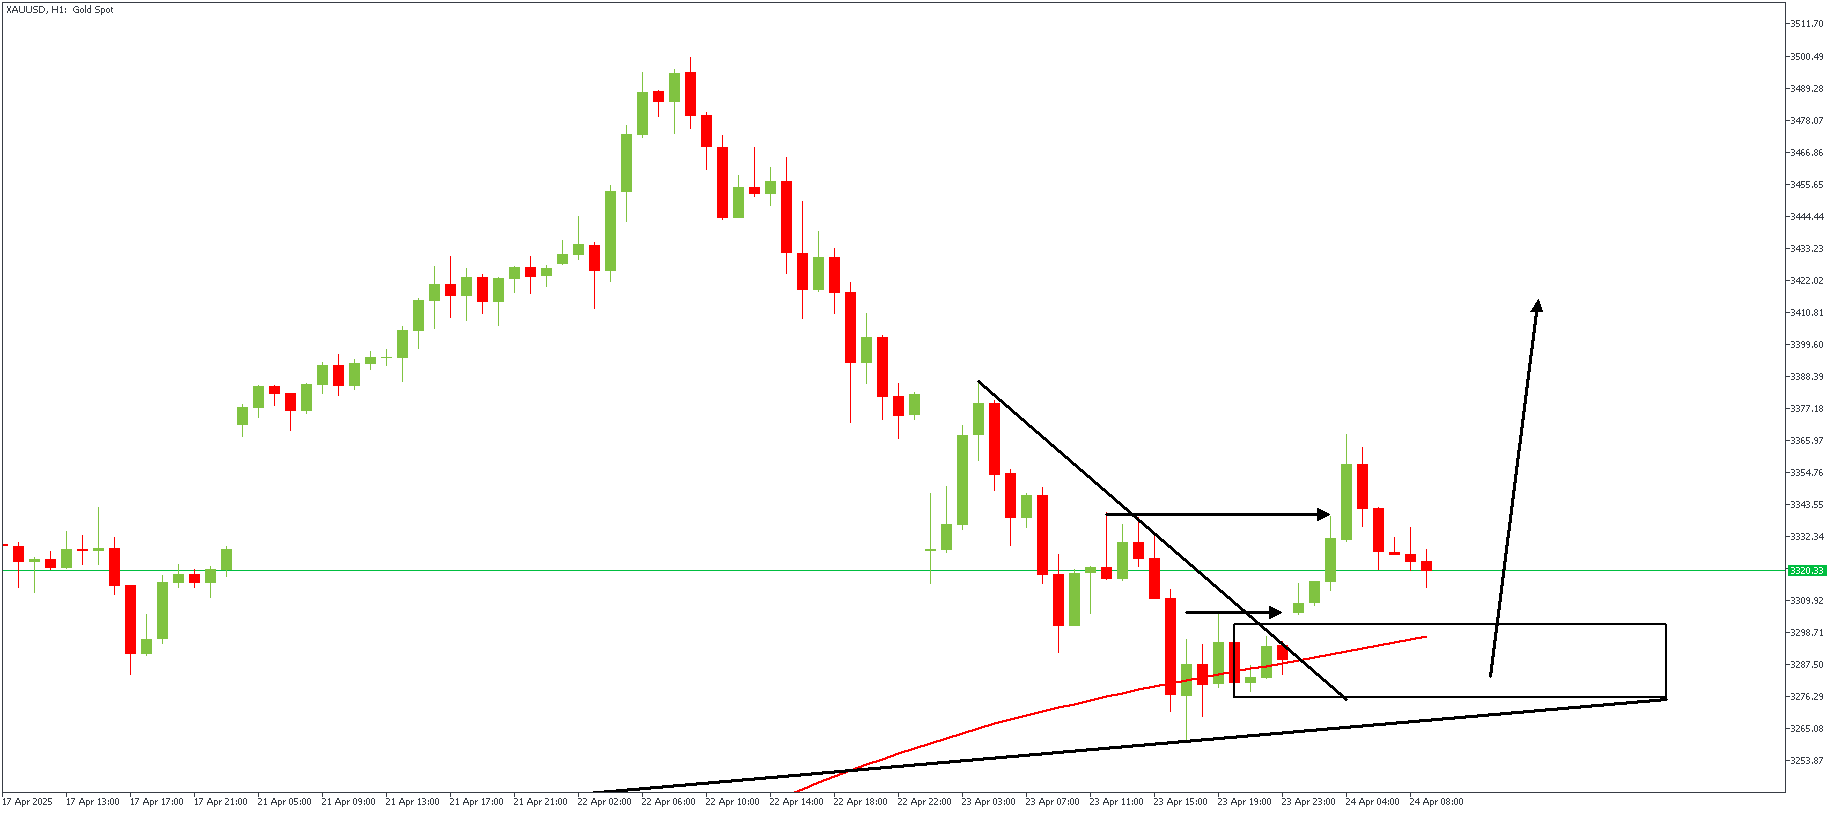
The 1-hour timeframe chart of XAUUSD shows the SBR pattern formed as the price movement pushed into the 100-period moving average support and the trendline support. In conjunction with the higher timeframe criteria, my conclusion favors continued bullish price action.
Analyst’s Expectations:
Direction: Bullish
Target- 3409.99
Invalidation- 3259.80
CONCLUSION
You can access more trade ideas and prompt market updates on the telegram channel.


