During Monday’s trading session, the British Pound (GBP) pulled back slightly against the Japanese Yen (JPY), testing the important 200-day EMA (Exponential Moving Average). So far, this level has held, and there are signs the pair might gather enough momentum to push toward the 195 yen mark. If the price breaks above 195 yen, it could pave the way for a move to the critical 200 yen level.
The GBPJPY pair is susceptible to global risk sentiment, so market behavior in the coming days will be crucial. The current sideways movement may provide a base for further gains. If the price breaks above the 50-day EMA, there’s potential for a rally toward 200 yen and possibly even 207.50 yen in the longer term.
GBPNZD – D1 Timeframe

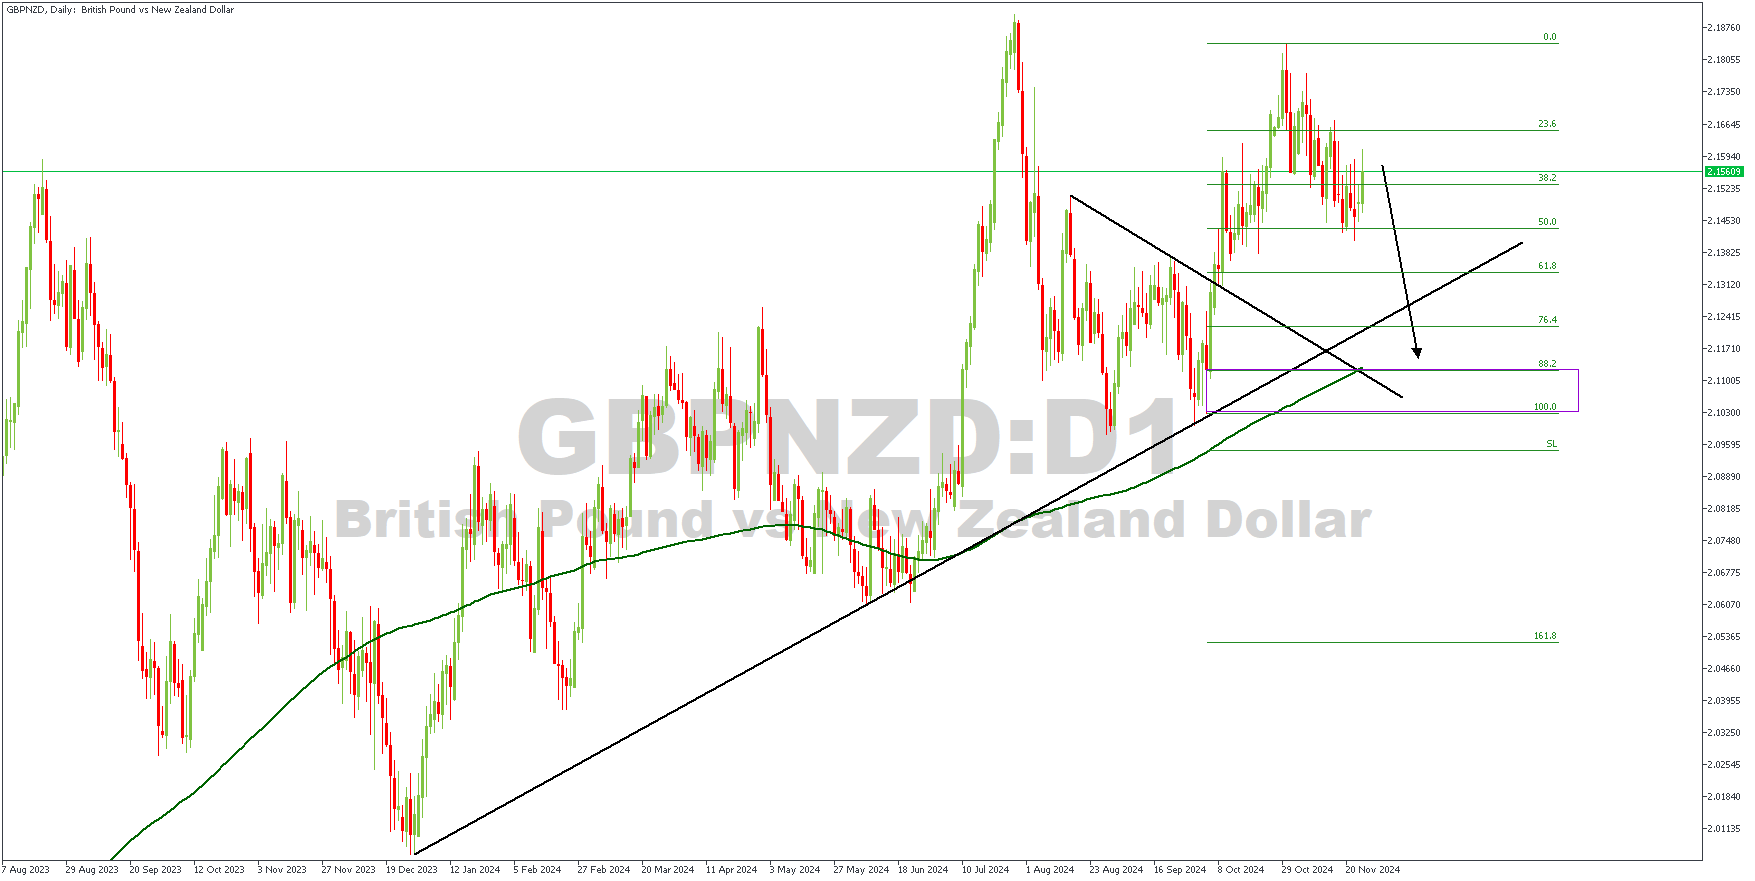
The daily timeframe chart of GBPNZD shows a break above the previous high, with prices currently consolidating near the pivot. Based on this, I expect the price to retrace bullishly to gather momentum on its way to the highlighted demand zone. Now, let’s look to the lower timeframe for deeper insights.
H4 Timeframe

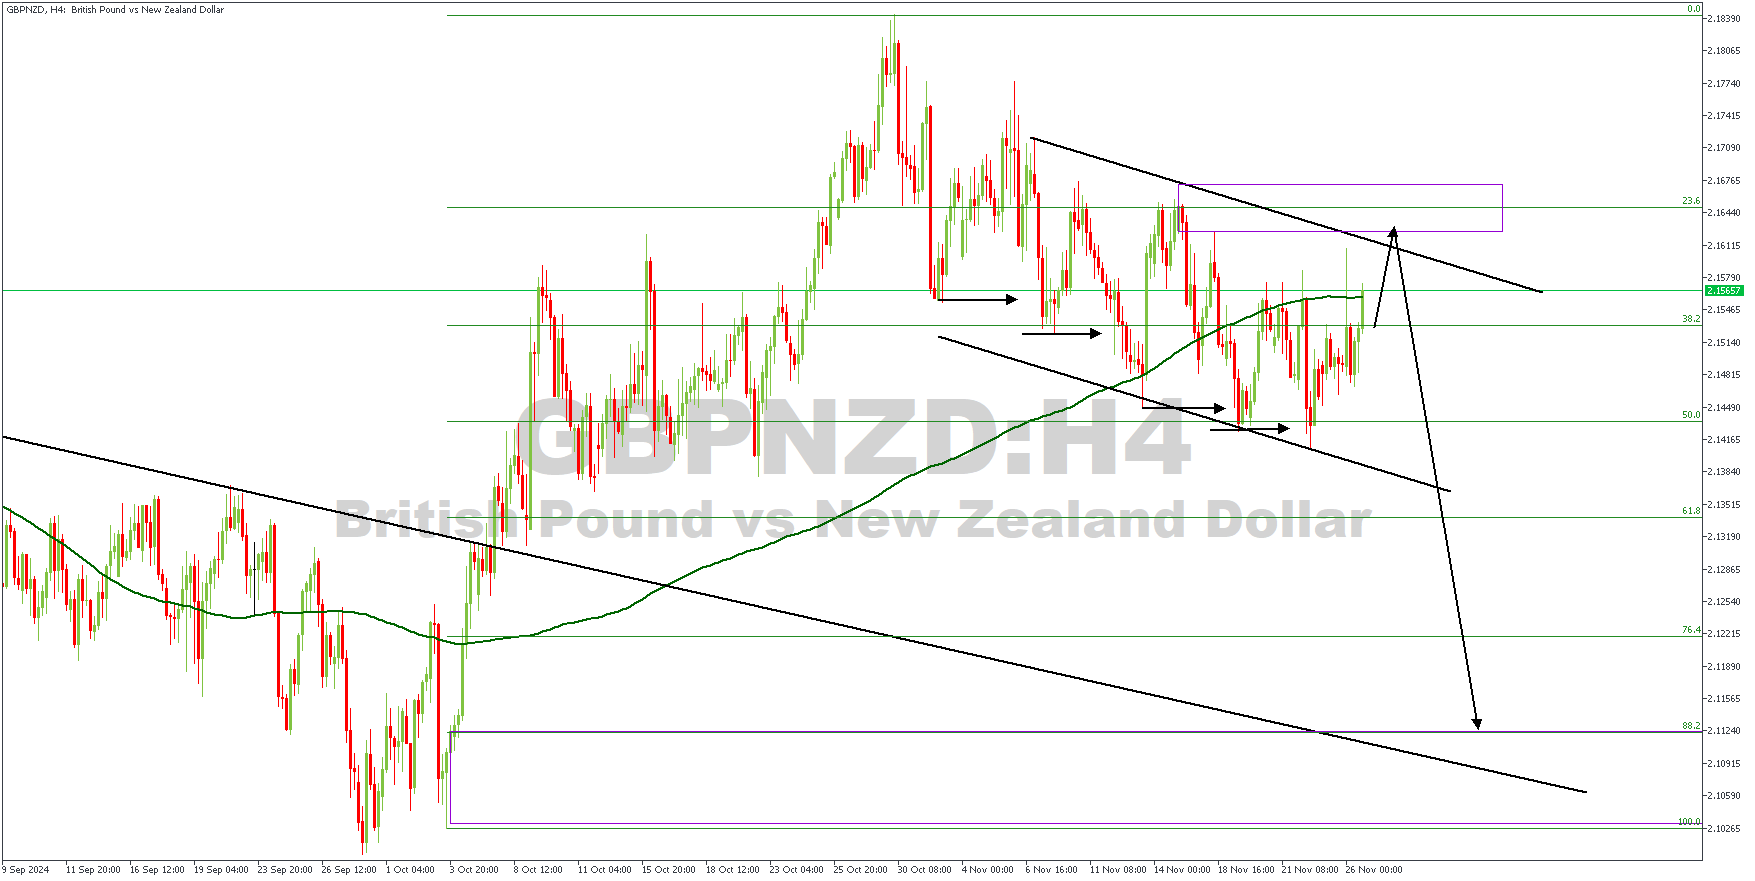
The 4-hour timeframe chart shows price trading within a descending channel, with a bullish movement climbing towards the rally-base-drop supply zone. The point of entry is the area of confluence between the trendline resistance and the supply zone. The microstructure also presents a typical head-and-shoulder pattern.
Analyst’s Expectations:
Direction: Bearish
Target:2.11526
Invalidation: 2.17255
CONCLUSION
You can access more trade ideas and prompt market updates on the telegram channel.


