USD Fundamental Analysis: Key Economic Events and Market Expectations for March 24-28, 2025
Monday, March 24
- S&P Global Manufacturing PMI (March)
Forecast: 51.9
Analysis: A stable manufacturing sector is anticipated. A reading above 51.9 could strengthen the USD, indicating increased economic activity. Conversely, a figure below expectations may suggest a slowdown, potentially weakening the dollar.
- S&P Global Services PMI (March)
Forecast: 51.2 | Previous: 51.0
Analysis: Slight growth in the services sector is expected. A result exceeding 51.2 would support the USD, while a lower figure might exert downward pressure.
Tuesday, March 25
- CB Consumer Confidence (March)
Forecast: 94.2
Analysis: Consumer confidence remains a pillar of growth. A reading above 94.2, despite being lower than the previous month, could still bolster the USD. A weaker result may raise concerns about consumer spending, negatively impacting the dollar.
- New Home Sales (February)
Forecast: 682K
Analysis: Figures surpassing the forecast would reinforce perceptions of a robust housing market, benefiting the USD. Conversely, lower numbers might signal a cooling sector.
Wednesday, March 26
- Durable Goods Orders (MoM - February)
Forecast: -0.6%
Analysis: The negative forecast suggests a potential slowdown in business investment, which could exert downward pressure on the USD. A positive result might indicate continued confidence in capital expenditures.
Thursday, March 27
- Final Quarterly GDP (Q4)
Forecast: 2.3% | Previous: 2.3%
Analysis: Confirmation of solid growth is expected. An upward revision could strengthen the dollar, while a downward adjustment, even slight, might lead to bearish corrections.
- Initial Jobless Claims
Forecast: 225K
Analysis: Any unexpected increase above the forecast could raise concerns about the labor market, potentially weakening the USD.
Friday, March 28
- Core PCE Price Index (YoY - February)
Forecast: 2.7%
Analysis: Moderate inflation growth is anticipated. Stable data may not affect the Fed's stance unless the figure exceeds expectations.
- Core PCE Price Index (MoM - February)
Forecast: 0.3%
Analysis: A reading above 0.3% would heighten inflationary concerns, which could be bullish for the dollar.
- Additional Factors Influencing the USD
Beyond economic data, Treasury yields have been rising, primarily due to expectations surrounding the new trade tariffs announced by President Trump, set to take effect on April 2. Markets await details on possible exemptions; any indication of stricter measures could further boost yields and the USD.
USD Outlook
Better-than-expected data: Strengthens the USD, reflecting solid growth and the possibility of the Fed maintaining current rates.
Worse-than-expected data: May weaken the USD, suggesting a slowdown and increasing pressure on the Fed for a potential rate cut.
Dollar Index (DXY), H4
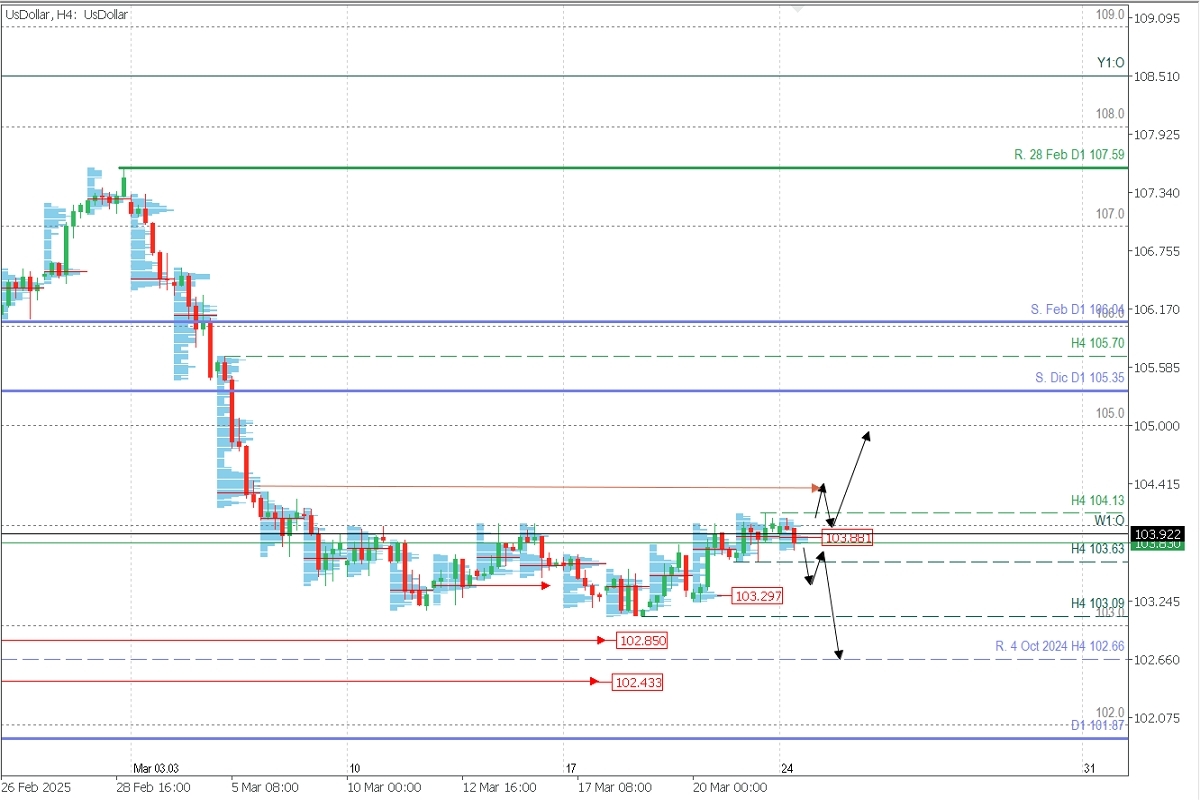
- Supply Zones (Sell Areas): 104.40 and 105.00
- Demand Zones (Buy Areas): 103.29 // 102.85 // 102.43
The index has been consolidating for the past two weeks with a moderately bullish bias. Currently, the key H4 support level stands at 103.63. A confirmed break below this level (with a second lower low) would signal that the USD will maintain its bearish bias for the week, potentially falling below 103.00 toward the demand zones at 102.85 and 102.43.
However, even if we see an initial break of this support, the USD could still recover as long as the price decisively breaks above resistance at 104.13 and doesn't fall back toward 103.00. In this scenario, we would consider intraday targets at 104.40 and 105.00 for the week, considering the compressed price action.
EURUSD, H4
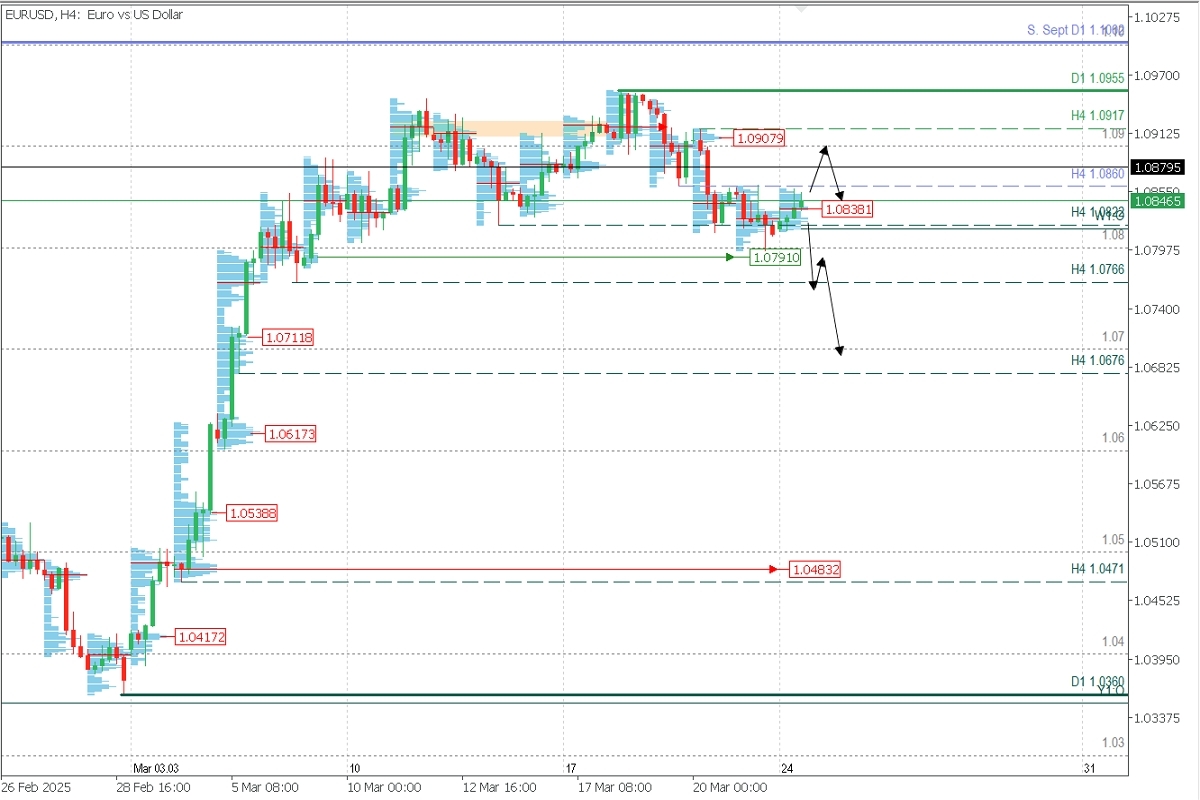
Supply Zone (Sell Area): 1.0908
Demand Zones (Buy Areas): 1.0791 // 1.0766 // 1.07
The pair has produced two breaks below the last validated intraday H4 support at 1.0822, leaving 1.0917 as the final key resistance level. This suggests a potential continuation of the bearish trend unless the price makes a confirmed break above the indicated key resistance.
The bearish continuation scenario would be considered valid with a price below 1.0838, even after a rebound toward the high-volume node around 1.09, with targets at support levels 1.0766 and extended to 1.07.
However, only a confirmed break (with a second higher high) above resistance at 1.0717 would indicate a renewal of the bullish bias, which could drive price toward 1.0955 or 1.10 during the week with increased volatility.
Breakdown Signal: Double break below 1.0822 (bearish).
Bullish Confirmation Needed: Break above 1.0917.
Technical Summary
Bearish: Sell below 1.0838 → TP 1.0790 → 1.0766 (extended 1.0700).
Bullish: Buy above 1.0860 → TP 1.0900 (break past 1.0917 targets 1.0955-1.1000).Reversal/Exhaustion Pattern (PER): Before entering any trades at the key zones we've indicated, always wait for the formation and confirmation of a PAR pattern on the M5 timeframe as we've shown here:
POC (Point of Control) Concept: POC refers to the level or zone with the highest volume concentration. If there was previous bearish movement from this level, it's considered a sell zone and forms resistance. Conversely, if there was previous bullish momentum, it's considered a buy zone, typically located at lows and therefore forming support areas.


