Cuña descendente
El patrón de cuña descendente es otro patrón gráfico técnico que sirve como señal de reversión de tendencia o continuación. Pero, a diferencia de la cuña ascendente, la cuña descendente se produce en la parte inferior de una tendencia bajista e indica un potencial aumento de los precios.
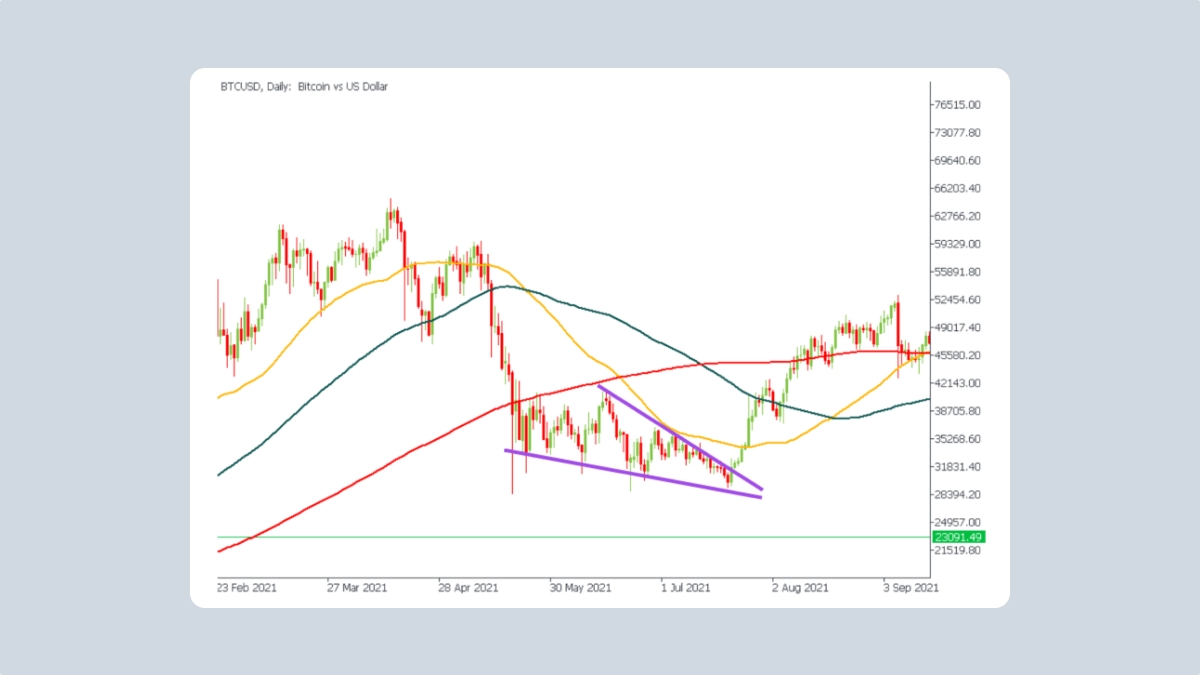
Como puedes ver en este gráfico, la cuña descendente generalmente aparece en la parte inferior de una tendencia bajista. La tendencia bajista en el gráfico se está ralentizando y la resistencia de los osos parece más débil en comparación con el soporte de los toros. La distancia entre las líneas de soporte y resistencia es cada vez más pequeña, siendo la línea de soporte la más estable de las dos. Justo cuando la tendencia está a punto de perder su impulso por completo y permitir que la línea de resistencia rompa la línea de soporte, el precio sube bruscamente y continúa subiendo, iniciando una nueva tendencia alcista. Los toros reúnen suficientes fuerzas para romper la resistencia de los osos, revirtiendo la tendencia bajista para siempre.
Una cuña descendente también puede ocurrir durante una tendencia alcista constante como parte de un repunte de precios de muy corto plazo. Pero en este caso, todavía sirve como un patrón alcista y señala la continuación de la tendencia alcista, a diferencia de la cuña ascendente.
¿Una cuña ascendente es alcista o bajista?
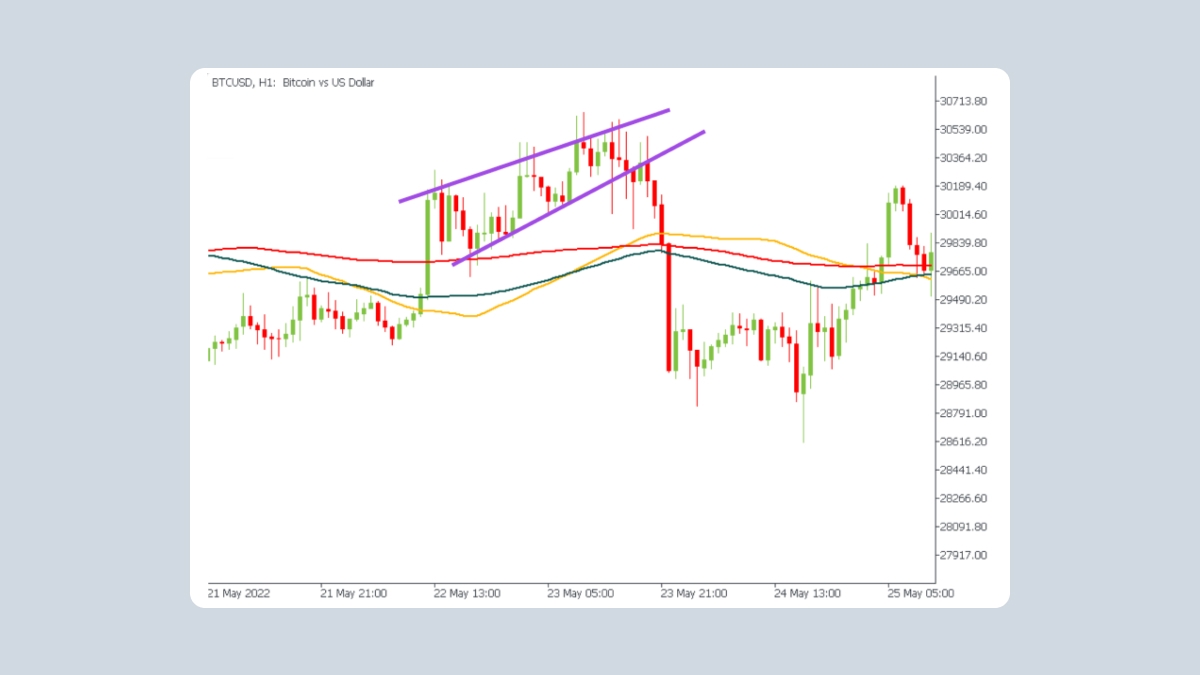
La cuña ascendente puede ocurrir tanto durante una tendencia alcista como bajista. En una tendencia alcista, viene antes de una reversión a la baja en el movimiento del precio. En una tendencia bajista, suele aparecer al final de un pequeño período de consolidación alcista. En ambos escenarios, los toros están cediendo constantemente a la presión de los osos; esto señala una reversión bajista o la continuación de la tendencia a la baja. Por lo tanto, una cuña ascendente se considera un patrón bajista.
¿Qué tan confiables son las cuñas ascendentes?
Cuando aparece una cuña ascendente en el gráfico, se considera una señal de un inminente rompimiento de la tendencia bajista. Los traders técnicos profesionales también lo elogian como un patrón bajista confiable. Además, la cuña ascendente es seguida de cerca por una ruptura con una fuerte caída del precio, por lo que muchos traders están atentos específicamente a este patrón para obtener máximas ganancias en un corto período de tiempo.
Al mismo tiempo, hay bastantes patrones falsos que los principiantes pueden confundir con una cuña ascendente. Para evitar esto, debes prestar mucha atención a las divergencias de precio/volumen. También es bueno saber que cuando un patrón de cuña ascendente es genuino y válido, el precio toca las líneas de soporte y resistencia al menos 3 veces.
Conclusión
En general, un patrón de cuña ascendente es ampliamente aceptado como un patrón de reversión bajista muy confiable y útil. Es fácil de detectar y puede aplicarse tanto a operaciones a corto plazo como a largo plazo.
Al mismo tiempo, es difícil interpretar una cuña ascendente sin tener en cuenta todas las condiciones del mercado actuales. Antes de tomar una decisión, es importante considerar la duración de la tendencia y el contexto de su formación. El uso de otros indicadores y herramientas técnicas puede ayudar a verificar que la supuesta cuña ascendente es realmente válida y predice una reversión bajista.
Finalmente, ahora que has identificado una cuña ascendente y viste la ruptura, puedes entrar en la operación. No olvides planificar tu salida estableciendo un objetivo de ganancias para tus posiciones. También puedes colocar una orden stop loss para minimizar los riesgos.