
¿Qué es el patrón de megáfono?
Un patrón de megáfono es un patrón gráfico que ocurre cuando hay volatilidad en el movimiento de un precio. Consiste en, al menos, los dos puntos máximos más altos y los dos mínimos más bajos formados a partir de cinco swings diferentes. Cada swing es más grande que el anterior, y tanto los máximos más altos como los mínimos más bajos se pueden conectar mediante dos líneas de tendencia divergentes asemejando la forma de un megáfono; de ahí el nombre del patrón.
Por lo general, puedes ver este patrón en la parte superior o inferior de un mercado. Esto sugiere que los traders no confían en la dirección del mercado e intentan entrar o salir de las operaciones en la primera oportunidad que tengan, lo que provoca que se formen swings más grandes.
En este artículo aprenderás diferentes formas de identificar un patrón de megáfono, si el patrón de megáfono es alcista o bajista, las características principales de este patrón y cómo operar con él cuando lo veas en un gráfico.
Puntos clave:
- Los patrones de megáfono ocurren en mercados volátiles cuando los toros y los osos compiten por controlar el mercado.
- El patrón de megáfono consta de cinco swings que forman, al menos, los dos puntos máximos más altos y los dos mínimos más bajos. Si las líneas de tendencia trazadas a través de los puntos máximos más altos y los mínimos más bajos divergen, entonces el patrón en cuestión es un megáfono.
- Los patrones de megáfono pueden ser alcistas o bajistas, pero es imposible saber con certeza qué patrón es hasta que el precio cierra fuera del patrón y confirma el inicio de una nueva tendencia o la continuación de la anterior.
- Los traders pueden usar patrones de megáfono en diferentes estrategias, dependiendo de su estilo de trading preferido y de si el patrón falla o no.
¿Cómo identificar un patrón de megáfono?
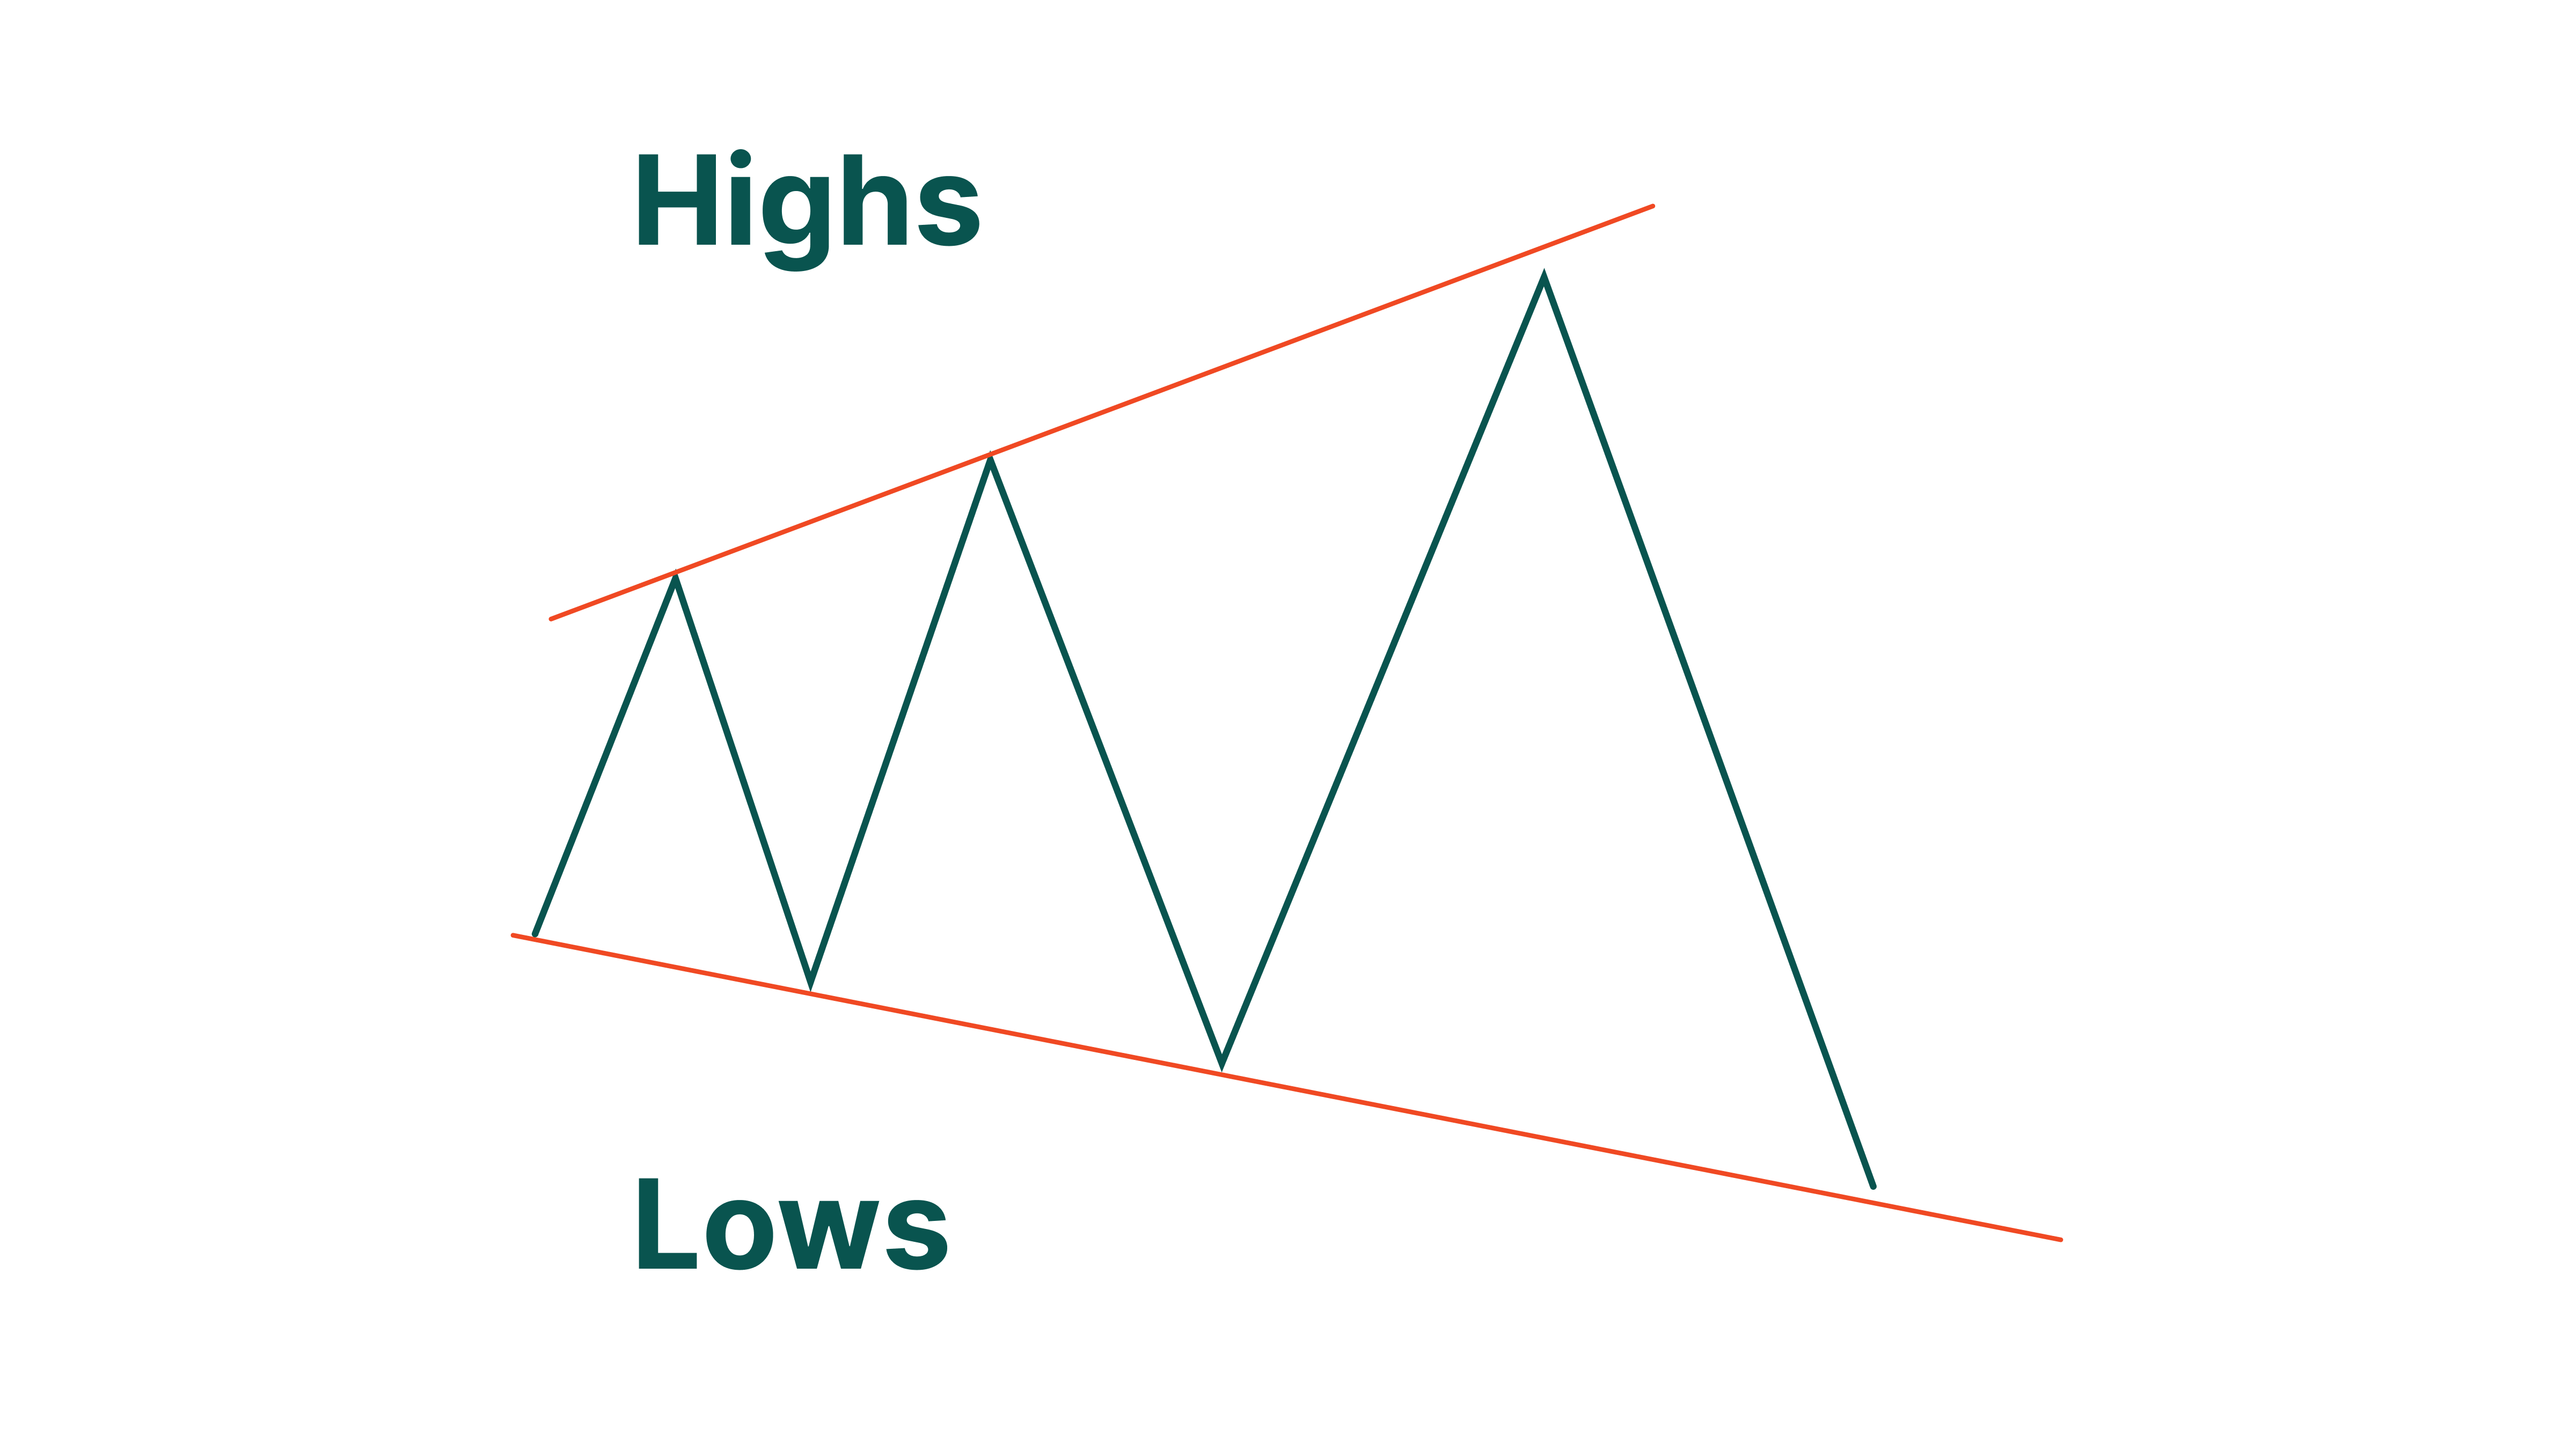
Como ya mencionamos, el patrón de megáfono consta de cinco swings que forman máximos más altos y mínimos más bajos. Si ves un precio moviéndose en swings similares dentro de un rango cada vez más amplio, puedes verificar si realmente se trata de un patrón gráfico de megáfono trazando dos líneas de tendencia: una a través de los puntos máximos más altos y otra a través de los puntos mínimos más bajos. Si las líneas de tendencia divergen en direcciones opuestas, definitivamente se trata de un patrón de megáfono.
Otra cosa que debes saber es cuándo y por qué puede aparecer un patrón de megáfono en un gráfico. Los patrones de megáfono ocurren cuando un mercado atraviesa un periodo de volatilidad. No indica una tendencia de precios en particular. Más bien, nos dice que los traders no parecen estar de acuerdo con el precio del activo. Ceden ante sus emociones y empiezan a comprar cuando el precio les parece bajo, y a vender cuando les parece alto. Estos swings impiden que el precio siga una tendencia particular, lo que provoca más indecisión entre los traders.
Naturalmente, también estos periodos de volatilidad llegan a su fin, por lo que existen buenas estrategias que permiten a los traders más prudentes utilizar el patrón de megáfono a su favor. Lo más importante es mantener la calma y no dejar que el pánico dicte tus decisiones.
¿Un patrón de megáfono es alcista o bajista?
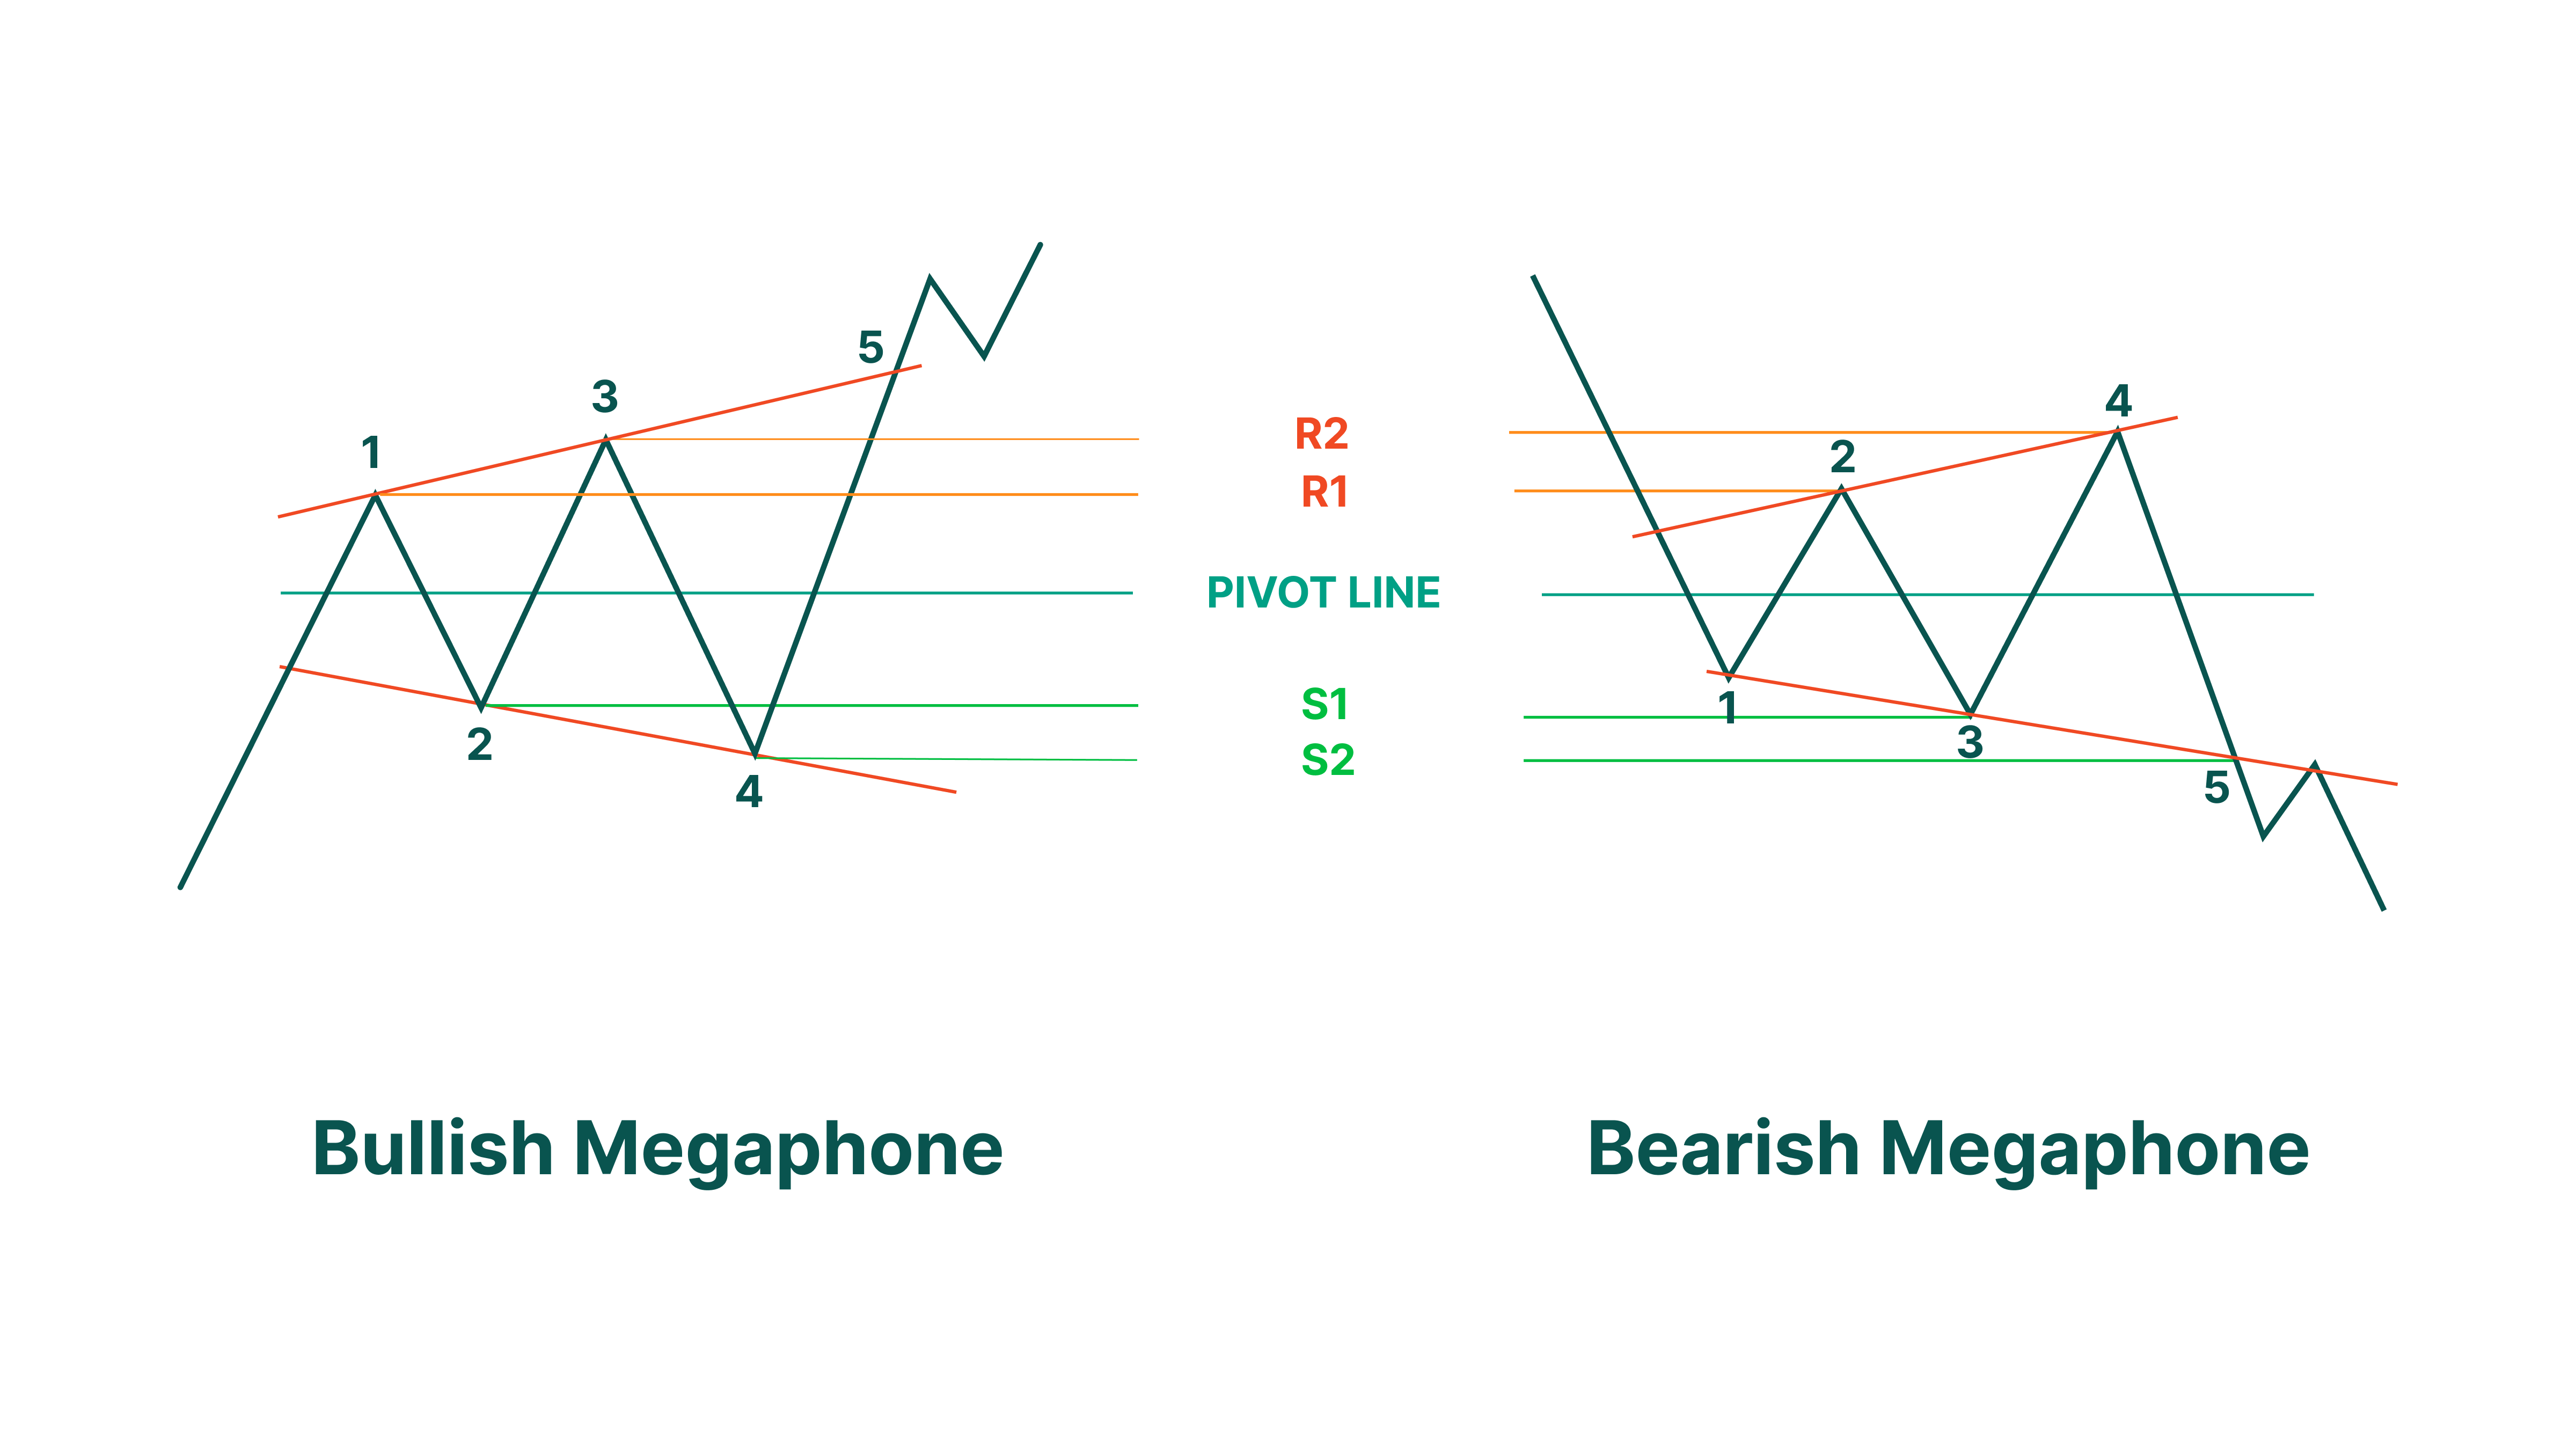
El patrón de megáfono puede ser tanto alcista como bajista, dependiendo de dónde se haya formado en el gráfico. Es por ello que los patrones de megáfono suelen dividirse en un techo de megáfono y un piso de megáfono.
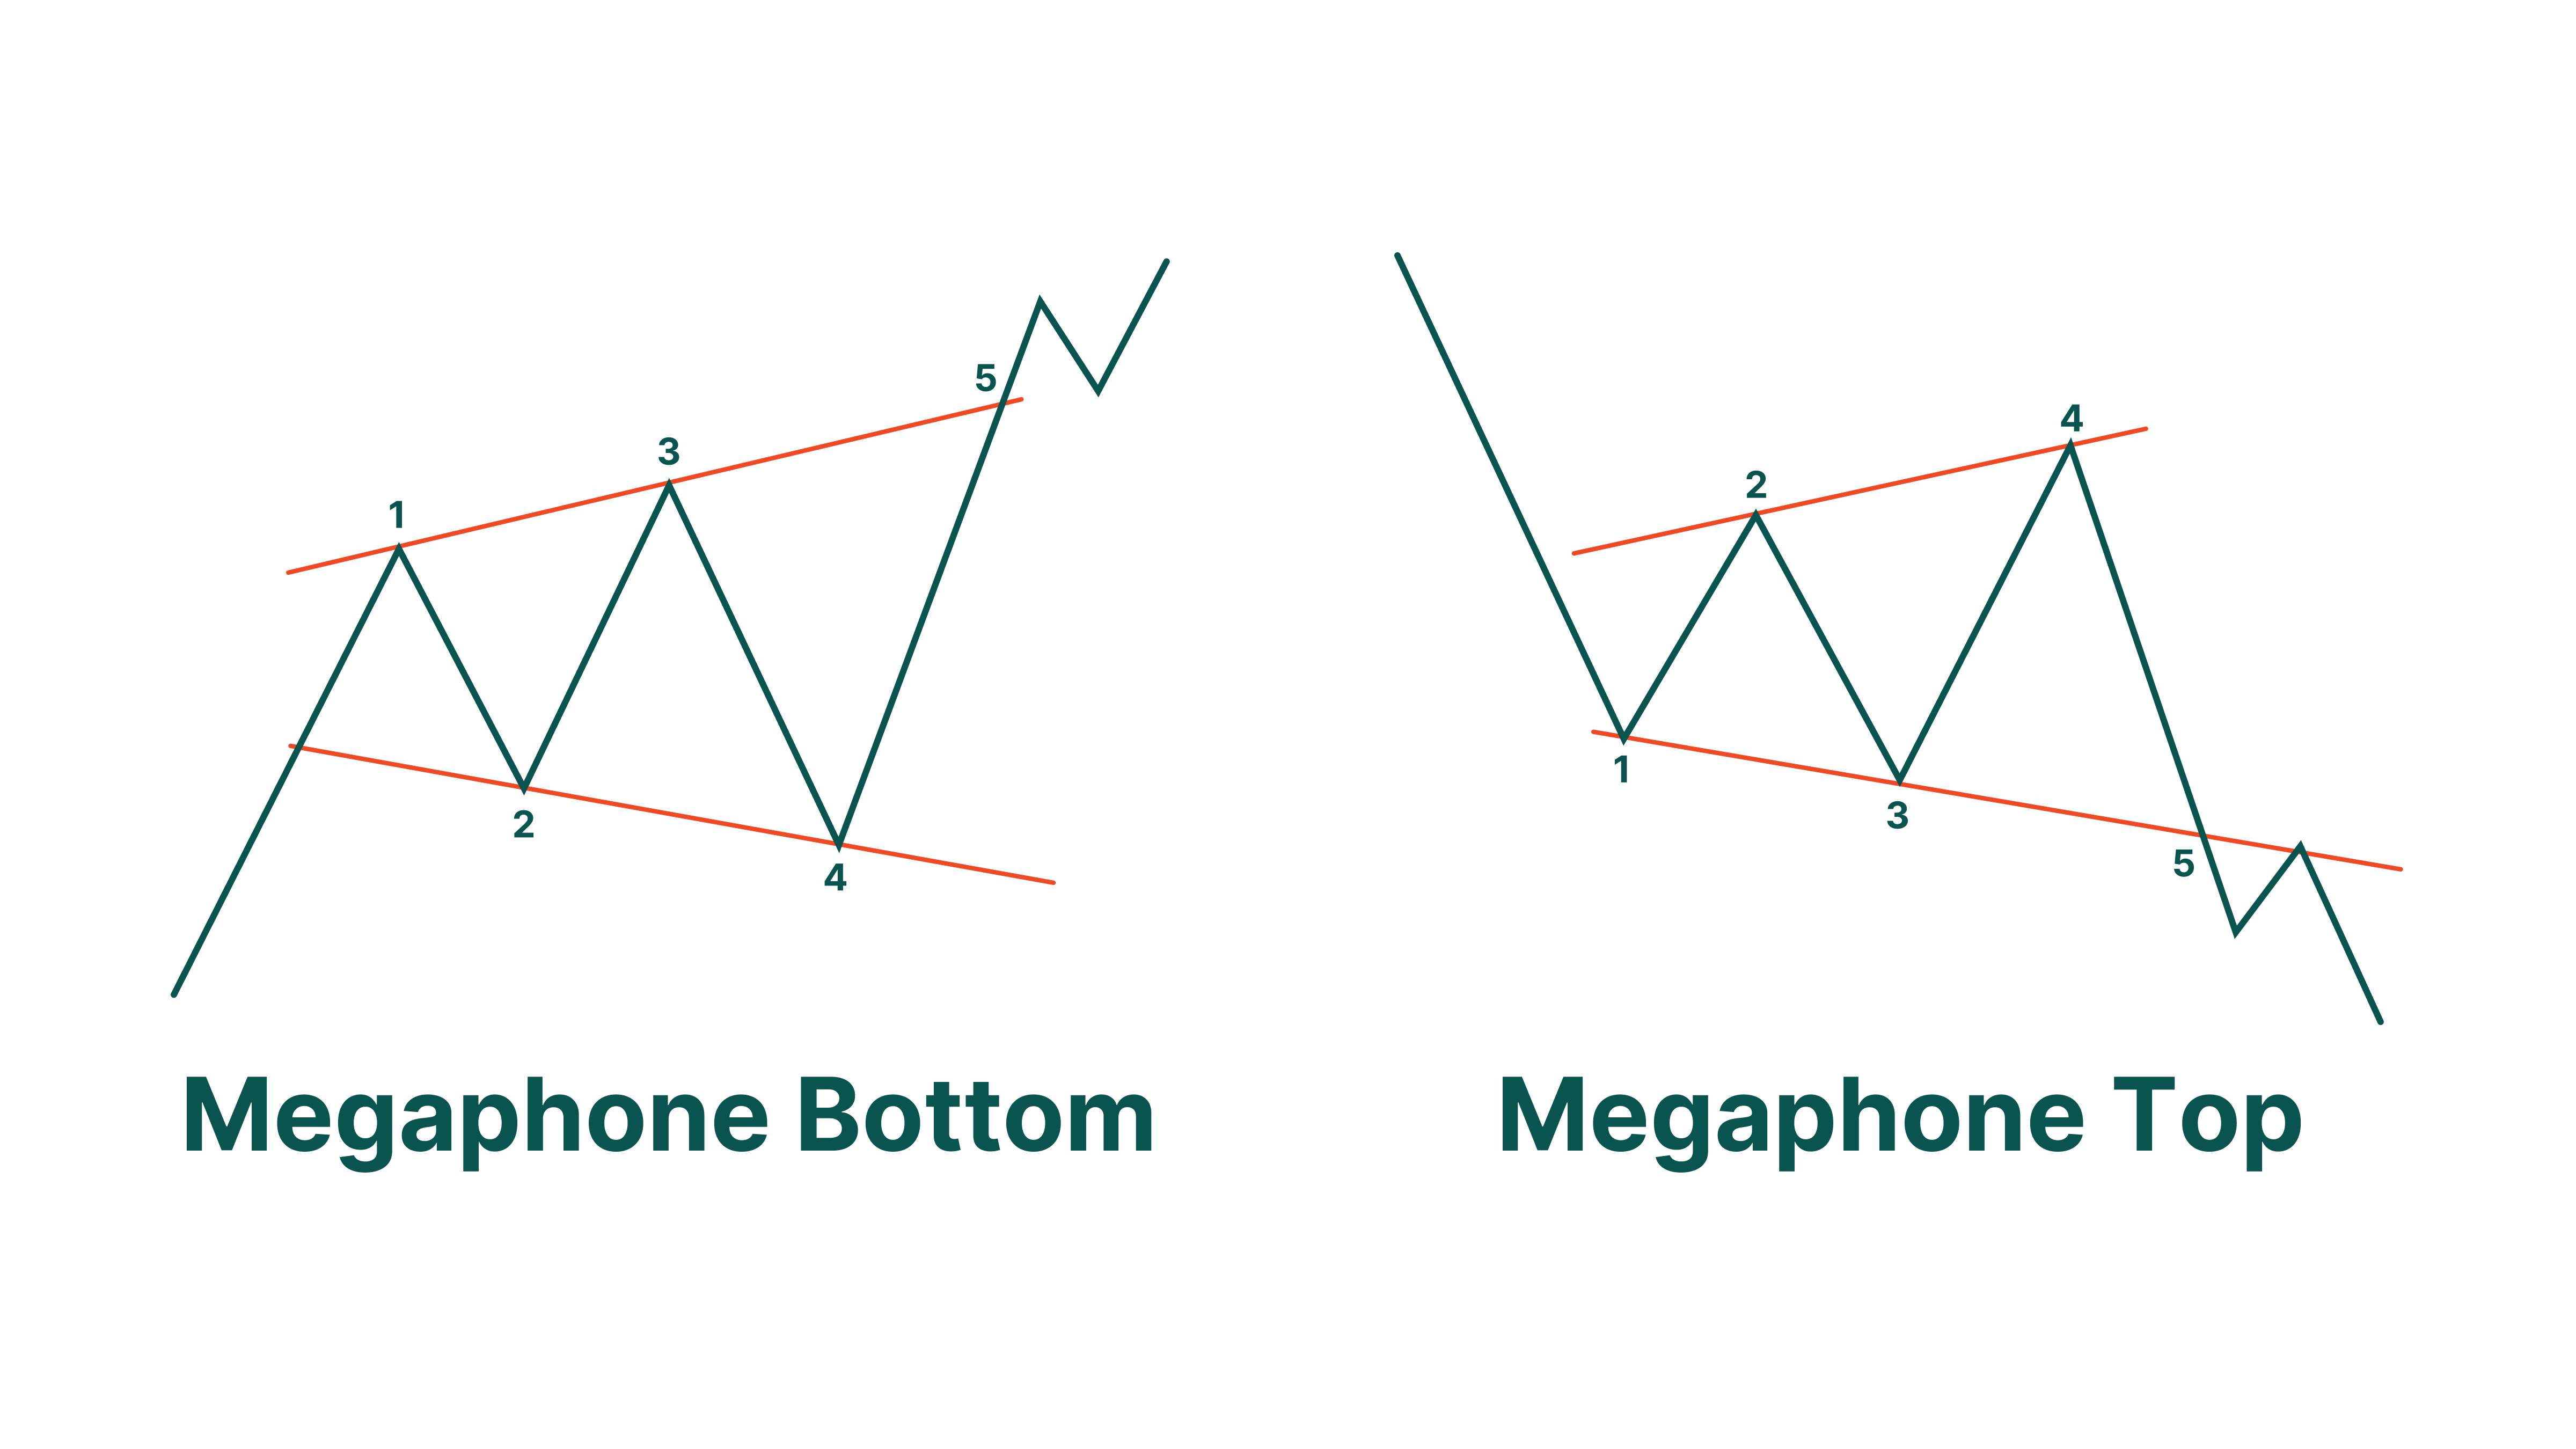
- El techo de megáfono es un patrón de megáfono bajista que indica una posible reversión de una tendencia alcista a una tendencia bajista o la continuación de una tendencia bajista. En general, el techo de megáfono consta de tres máximos más altos y dos mínimos más bajos. Se considera que el patrón está completo cuando el precio rompe la línea de tendencia trazada a través de los valles del patrón. Si esto ocurre, existe una posibilidad muy alta de que el mercado comience a moverse hacia una nueva tendencia bajista.
- El piso de megáfono se considera menos común que su contraparte bajista. En contraste con el techo de megáfono, el piso de megáfono es un patrón de megáfono alcista que ocurre antes de una posible reversión de una tendencia bajista a una tendencia alcista o indica la continuación de una tendencia alcista. Este patrón tiende a incluir tres mínimos más bajos y dos máximos más altos. Después del tercer mínimo, el precio generalmente se mueve al alza y rompe la línea de tendencia trazada a través de los máximos, lo que indica la finalización del patrón y el comienzo de una nueva tendencia alcista.
Sin embargo, es imposible decir si estos patrones de megáfono preceden a la reversión o continuación de una tendencia. Para saber con certeza la dirección de la tendencia futura, es mejor esperar hasta que el precio supere la línea de soporte o resistencia y se confirme el patrón. Solo entonces es seguro ingresar una operación.
¿Qué es una formación ampliada?
Una formación ampliada es otro nombre para lo que ahora conocemos como un patrón de megáfono. Las formaciones que se amplían pueden ser alcistas (piso que se amplía) o bajistas (techo que se amplía) y, por lo general, indican un posible cambio de tendencia.
Pero si observamos el panorama general, las formaciones ampliadas son más famosas por ser indicadores de volatilidad. Comienzan a formarse cuando un mercado está experimentando un periodo de mayor riesgo. Esto ocurre porque los traders no están seguros de hacia dónde se moverá el precio a continuación, por lo que fluctúa entre subidas y bajadas.
Las formaciones ampliadas también ocurren más durante temporadas de ganancias, cuando las empresas comienzan a reportar sus ganancias trimestrales. Dependiendo de si una empresa ha tenido éxito o no, los traders tendrán diferentes reacciones optimistas o pesimistas, lo que afecta el movimiento de precios y puede llevar a la formación de un patrón de megáfono.
Características de un patrón de trading de megáfono
Ya que ahora sabemos qué es un patrón de megáfono, estudiemos sus principales parámetros con más detalle.
Volumen
El primer parámetro al que debes prestar atención de un patrón de megáfono es el volumen. Como sabrás, el volumen es un indicador técnico que representa la cantidad total de un activo que fue operada durante un cierto periodo de tiempo. El volumen muestra cuántos traders están activos en el mercado y si el activo en cuestión está actualmente en demanda o no. Los traders también utilizan el volumen para confirmar la continuación o la reversión de una tendencia. Entonces, como puedes ver, el volumen puede darte bastante información sobre la situación actual del mercado.
El volumen ayuda a los traders a reconocer un patrón de megáfono en un gráfico. Los traders pueden ver que el volumen aumenta junto con el precio dentro del patrón de megáfono. También puedes notar que el volumen generalmente aumenta y permanece alto cuando se forma el patrón. Sin embargo, el volumen no indica una posible reversión ni continuación de la tendencia anterior, ya que no parece nada fuera de lo común cuando ocurre alguna de ellas.
Comportamiento subyacente
Lo siguiente que veremos es el comportamiento subyacente. Como aprendimos, se produce un patrón de megáfono cuando los traders intentan obtener el control del activo. Los toros siguen comprando y elevando el precio del activo mientras que los osos, por el contrario, intentan contrarrestar este desarrollo y venden el activo mientras el precio es alto, llevándolo cada vez más abajo. Los swings de los precios siguen formando nuevos máximos y mínimos, y si trazas dos líneas de tendencia a través de estos puntos, notarás que las líneas divergen en diferentes direcciones. Como regla general, esta incertidumbre y tensión creciente suele terminar cuando una de las partes se abstiene de realizar más acciones y la otra parte domina el mercado. El patrón termina con la tendencia moviéndose en la dirección del ganador, ya sea continuando o revirtiendo la tendencia anterior.
Cómo operar con patrones de megáfono
A pesar de su naturaleza no concluyente, los patrones de megáfono brindan muchas oportunidades de trading. Los patrones de megáfono se pueden incorporar en múltiples estrategias, según el estilo de trading del usuario.
Operaciones de ruptura
La primera forma de operar con un patrón de megáfono es con rupturas. Una ruptura ocurre cuando el precio rompe una de las líneas de tendencia y cierra fuera del patrón. Estas pueden ser alcistas o bajistas, y los traders las toman como la confirmación del patrón y la dirección de la siguiente tendencia.
Operar rupturas significa esperar hasta que el precio cierre fuera del patrón, confirmar la finalización del patrón de megáfono e ingresar una operación cuando la dirección del movimiento del precio sea clara. Ten en cuenta que es mejor esperar un poco para ver si la ruptura falla antes de tomar una decisión.
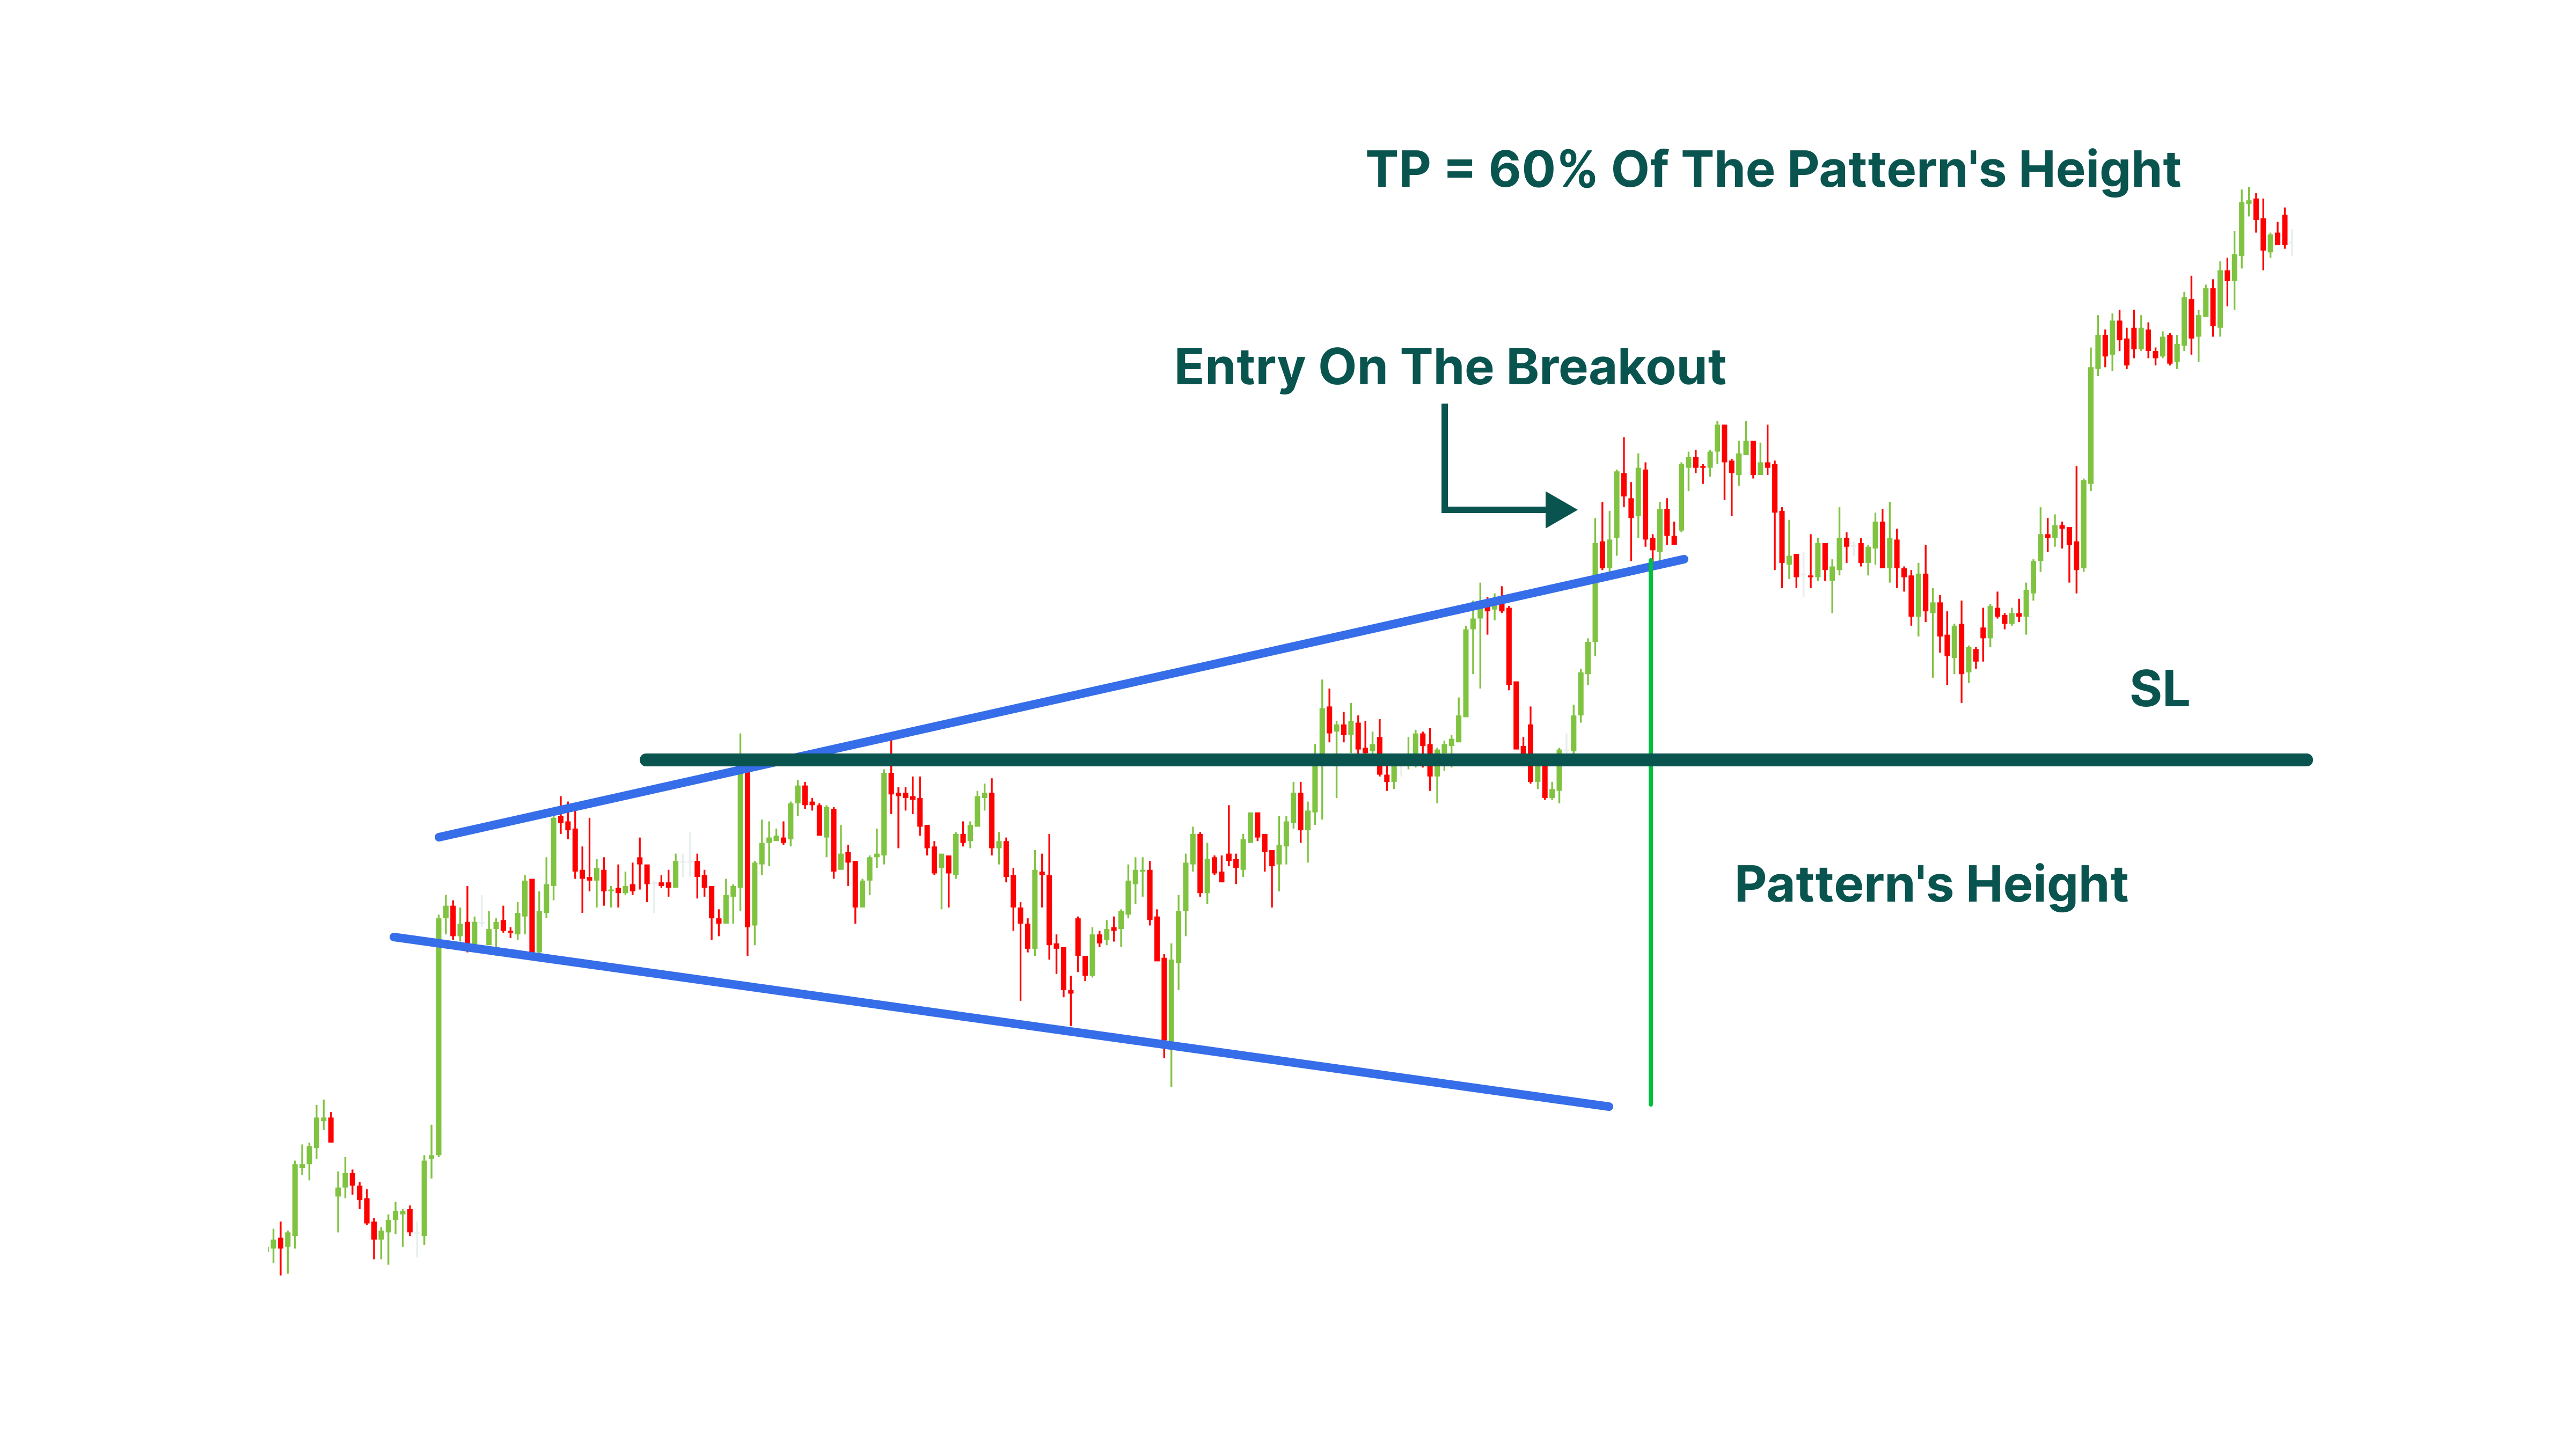
Cuando se trata del objetivo mínimo, la estrategia común es medir la distancia entre el punto máximo más alto y el punto mínimo más bajo del patrón, trazar una línea de la misma distancia desde el punto de la ruptura en la dirección de la nueva tendencia y luego colocar el objetivo mínimo en el 60% de la longitud de la línea resultante.
En cuanto al stop loss, la regla general es trazar una línea a través del segundo Máximo del Punto Pivote (para una tendencia alcista) o el Mínimo del Punto Pivote (para una tendencia bajista) y colocar la orden stop loss en este nivel.
Swing trading
Dado que los patrones de megáfono consisten en múltiples swings, este es un buen patrón para hacer swing trading. Los swing traders ganan con los mercados volátiles, aprovechando la indecisión de la mayoría de los traders. En el caso de los patrones de megáfono, los swing traders pueden intentar operar dentro del patrón, comprando cuando el precio alcanza un nuevo punto mínimo más bajo y vendiendo cuando marca un nuevo punto máximo más alto. Esto generalmente requiere que esperen la confirmación de que el precio no ha roto ninguna de las líneas de tendencia.
Pero también es posible operar con swings dentro del patrón. Todo lo que necesitas hacer es utilizar las líneas horizontales formadas por los picos y valles del patrón, así como la línea de pivote. Además, es posible utilizar los niveles de retroceso de Fibonacci para encontrar posibles líneas de soporte y resistencia para operar directamente dentro del patrón de megáfono.
Fallas
Al igual que cualquier otro patrón, el patrón gráfico de megáfono puede fallar en la ruptura. A pesar de eso, todavía es posible operar con él, aunque es importante identificar la falla correctamente. De hecho, es bastante fácil porque se considera que un patrón de megáfono falla si el precio no rompe una de las líneas de tendencia después del quinto swing. Entonces, si ves este patrón en un mercado alcista, por ejemplo, y notas que el precio rebota en una línea de tendencia después del quinto swing, deberías considerar ir corto cuando el precio caiga por debajo del nivel de soporte más cercano.
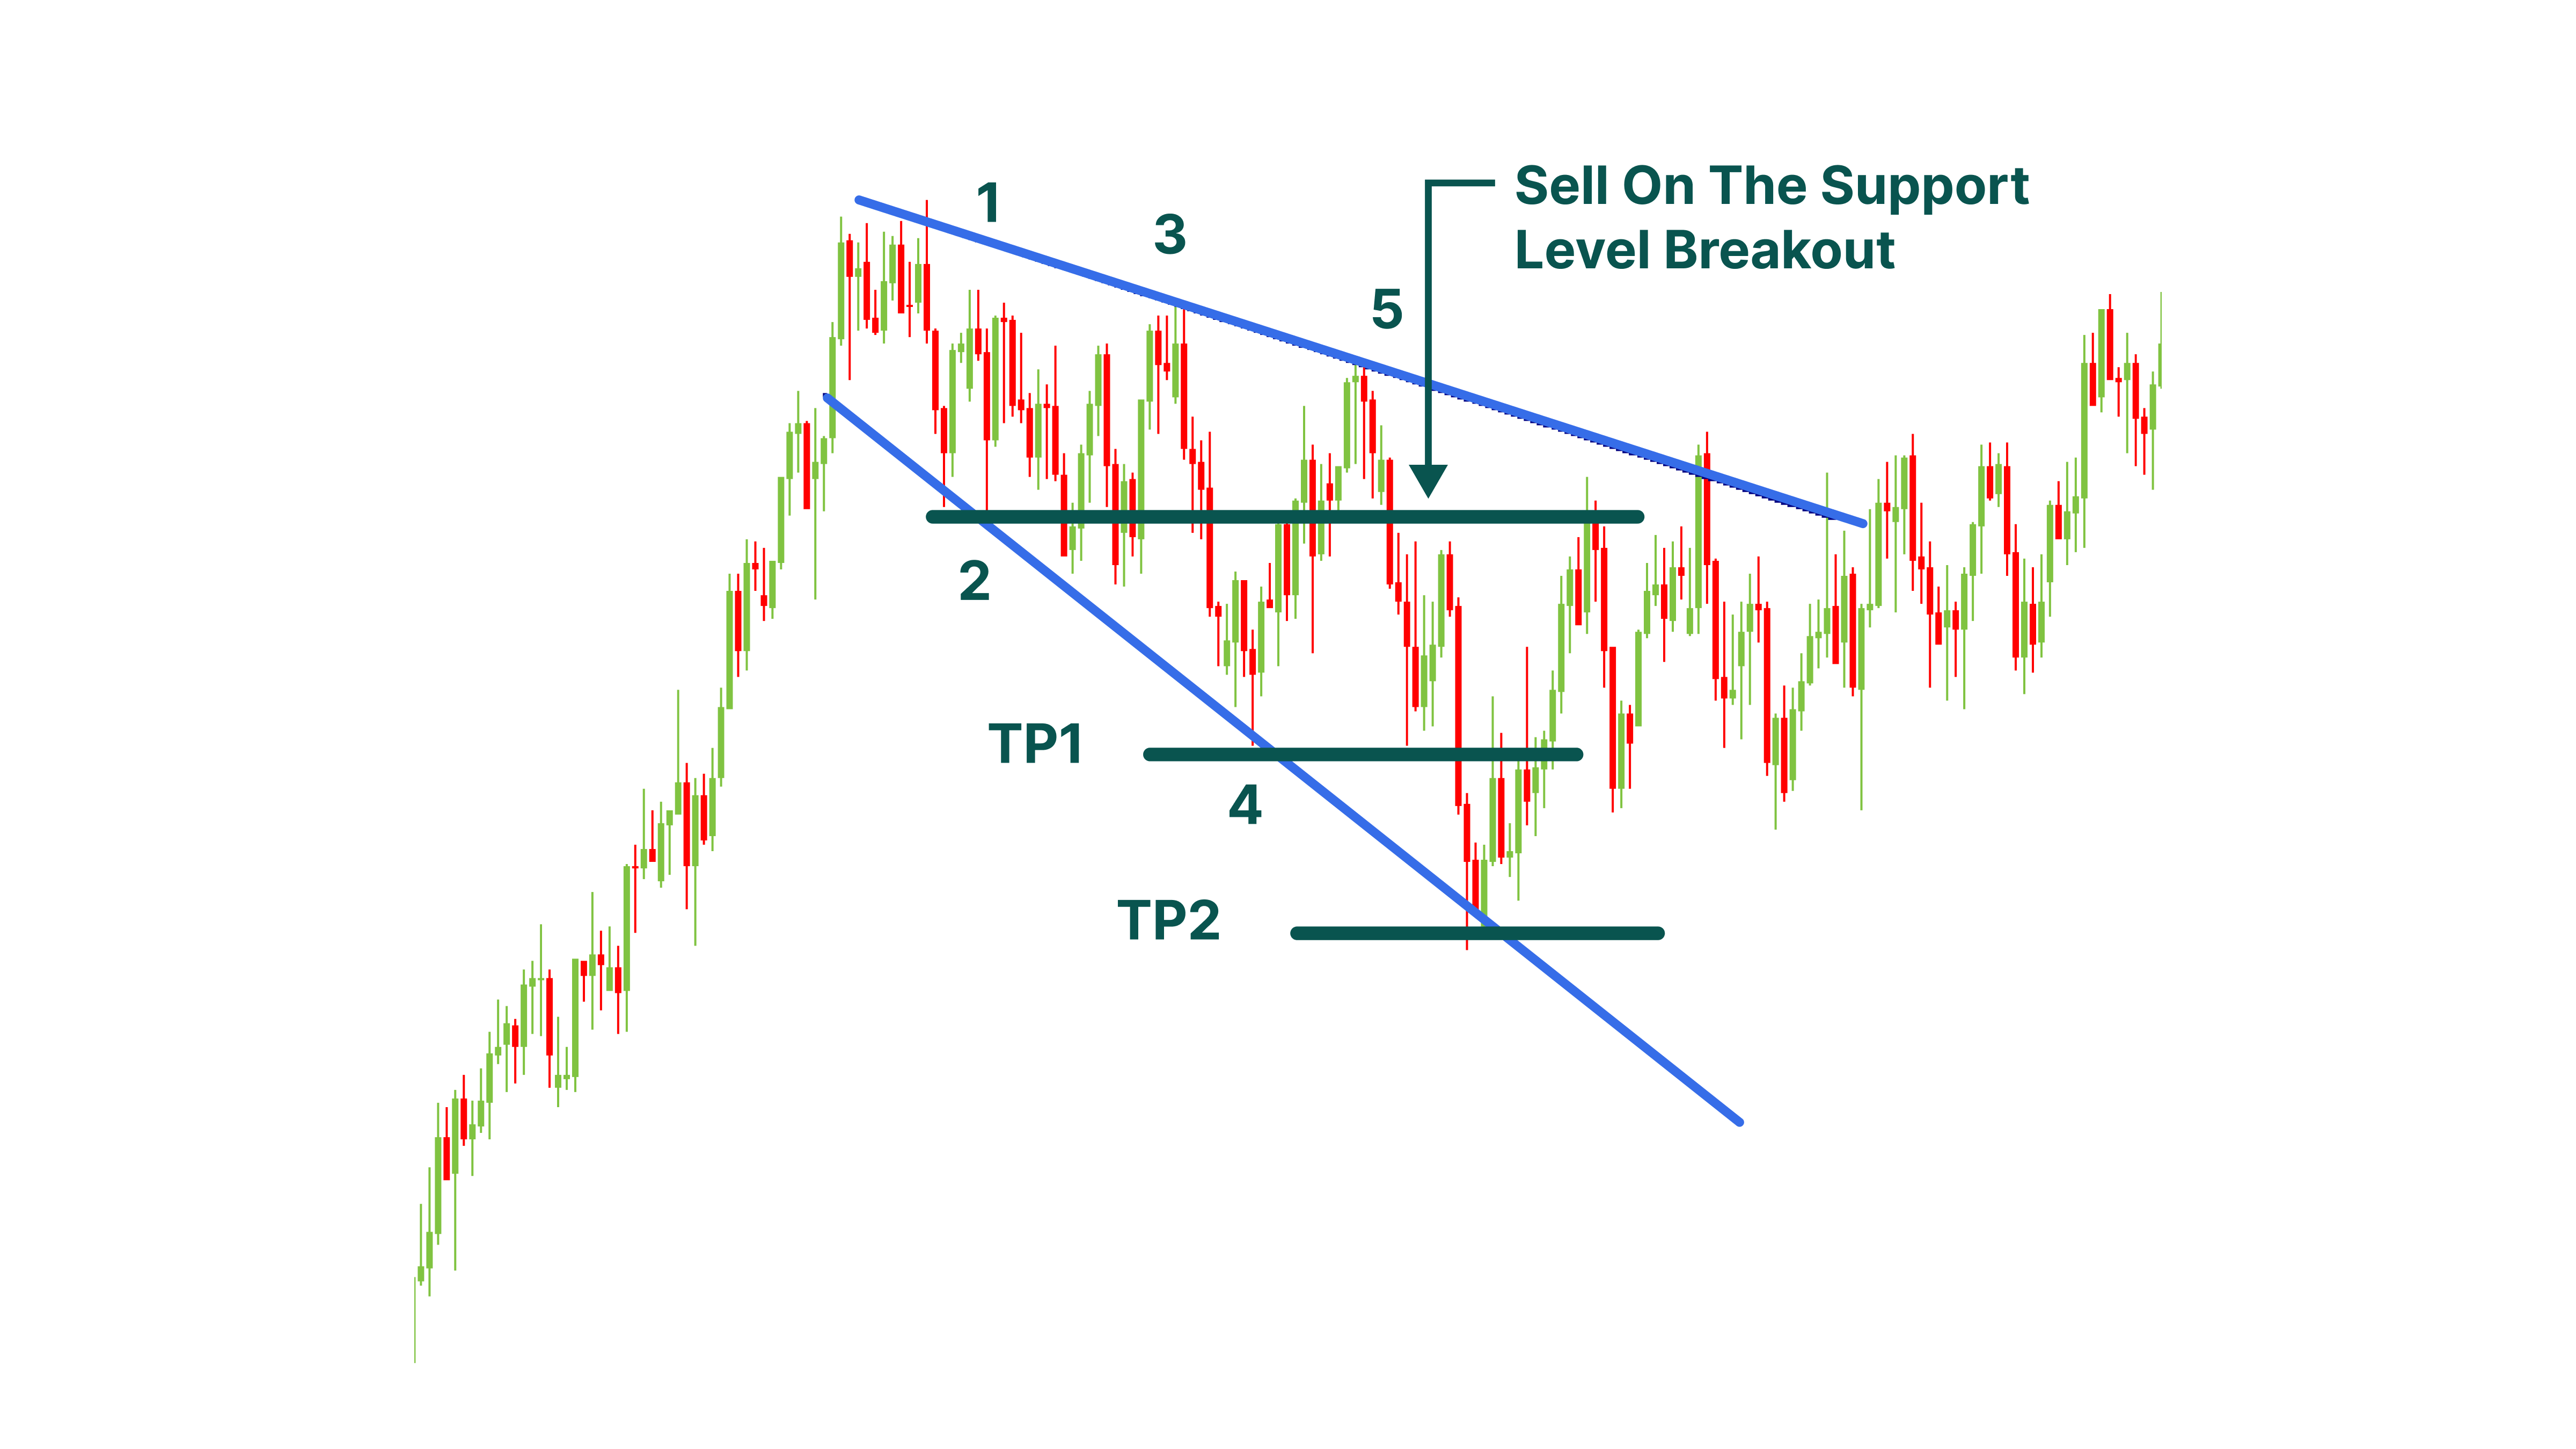
En este caso, puedes usar los niveles formados por el Punto Pivote 4 como tu primer objetivo de trading y colocar el segundo potencial objetivo en la línea de tendencia inferior del patrón. En cuanto a la orden stop loss, puedes colocar una en el nivel en el que el precio no logró romper el patrón después del quinto swing. También puedes aplicar la relación riesgo-recompensa de acuerdo con tu propia estrategia de trading.
Conclusión
En este artículo aprendimos sobre el patrón gráfico de megáfono. El patrón gráfico de megáfono ocurre cuando el mercado atraviesa un periodo volátil y los traders no pueden decidir cuál debería ser el precio real del activo en cuestión.
Los patrones de megáfono pueden ser alcistas y bajistas, pero es difícil predecir a dónde se dirige el movimiento de los precios y encontrar los mejores puntos de entrada y salida sin usar indicadores adicionales y herramientas de análisis técnico.