Open account
Open accountLog In
Open account

Aug 20, 2025

Strategy

What Is a Spinning Top Candlestick Pattern?

In this article
Spinning Top Candlestick Pattern

In trading, candles can form patterns that can be your best friends or worst enemies. Some are very obvious signals, while others are a lot more subtle. A Spinning Top is one of the quiet signals. It's a candle that shows you the market is hesitating. When used with other economic indicators and data, it can indicate the market is going to reverse. Let’s dive deeper.

Characteristics of a Spinning Top

  • Small body: The open and close are almost the same.

  • Long upper and lower wicks: The price traveled far both ways without following through.

  • Neutral signal: It reflects hesitation, not direction.

A Spinning Top is a single candlestick. It shows indecision in the market. The candle has a small body and long shadows, or wicks, above and below. That tells you the price moved in both directions but couldn’t hold either way. It’s like the market tried to go somewhere but ran out of conviction.

You’ll often see Spinning Tops form after strong trends up or down. They don’t mean a reversal is coming, but they are opportunities to stop and have a closer look. They mark pauses. If the next candle is red and breaks the low of the Spinning Top, it could signal a shift from bullish to bearish momentum.

The context gives it meaning. Used on its own, the Spinning Top doesn’t signify much. It also won’t really stand for a lot if it forms in a sideways market or inside a tight range. A Spinning Top will matter when it shows up near key levels like support and resistance levels, or Fibonacci retracements, and when the next candle confirms a shift.

A Spinning Top can appear on any timeframe. It can mean different things depending on which one it forms on. On a 5-minute chart, for example, a Spinning Top could indicate a moment of hesitation in a fast-moving market. On a daily or weekly chart, it could signal that a potential shift in a longer-term trend is coming.

Take the size of the candle into consideration as well. If the wicks are very long compared to its body, they suggest higher volatility and a stronger tug-of-war between buyers and sellers. Smaller wicks might show less energy or a quieter session.

Bullish vs bearish Spinning Tops

Spinning Tops are neutral, but there's a small detail that can add context: whether they close slightly above or below the open.

Bullish vs bearish Spinning Tops

A bullish Spinning Top closes a little above the open. This means buyers had a tiny win, even if it ultimately wasn’t convincing. If this happens after a downtrend, it can hint that the selling pressure might be easing. It’s not a signal to buy now, but rather to watch what happens. 

A bearish Spinning Top is the opposite scenario. It closes just below the open, which means sellers had a bit more control, but not enough to drive the price convincingly lower. After a long uptrend, this may suggest that the buying energy is weakening.

Here’s an example. The EURUSD currency pair has been falling steadily, and a Spinning Top forms and closes slightly higher. Alone, that can just be a random green candle. But the RSI is at 30, signaling it's oversold. The combination of the two might be telling you that the sellers are losing steam.

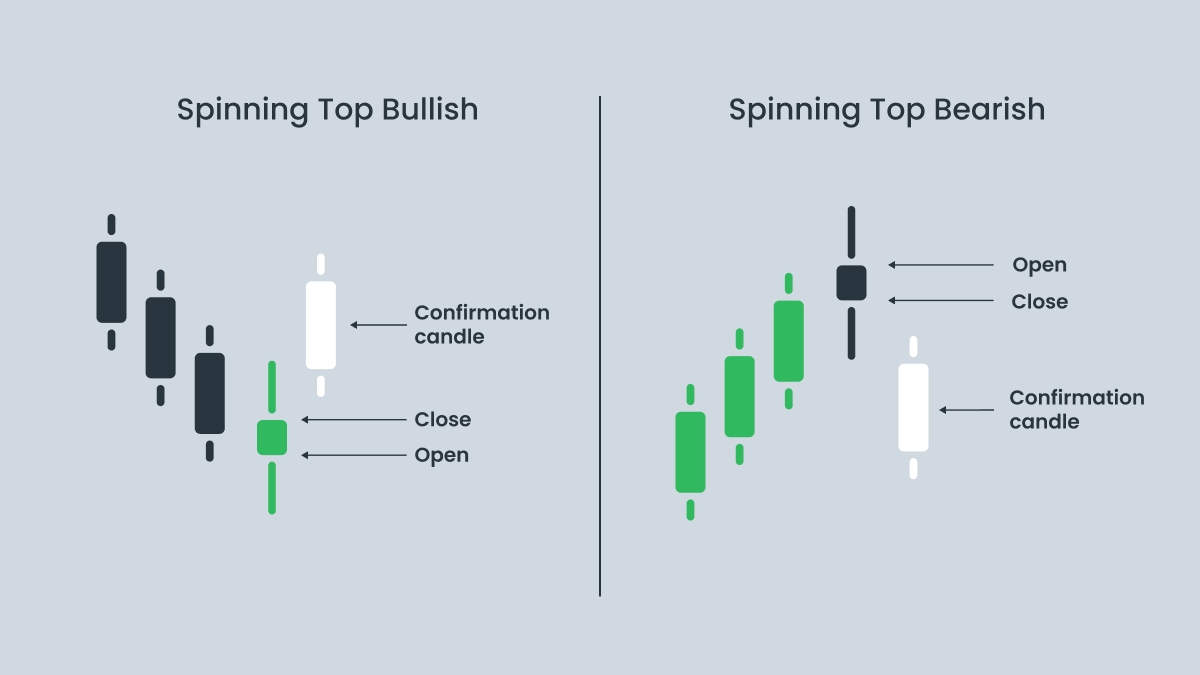
Both patterns look nearly the same. They have the same size body and the same long wicks. The body’s color doesn’t carry much weight unless the next candle gives you some type of confirmation.

Spinning Tops vs other candlestick patterns

A common mistake is mistaking Spinning Tops for Doji candles. At first glance, they look similar, and they both show indecision. But the meaning and structure are different.

A Spinning Top is like a balanced tug-of-war where both teams pull the price into their territory but can’t hold it and end back near the start. All it shows is hesitation, unless a reversal is confirmed. Their bodies sit right in the middle of their range, and both of their wicks are long and of equal length. That makes them neutral. They need something else to confirm where the market is headed, such as the next candle or a support or resistance level.

A Doji candle , on the other hand, shows total indecision, as if no team pulled it anywhere. If this forms after a strong trend, it can signal a potential reversal.

 Spinning TopDoji candle
Real bodySmall, but visible and coloredTiny or nonexistent (open ≈ close)
Shadows/wicksLong upper and lower wicksThey can vary (long, short, or no wicks)
Market messageIndecision, slight effort from both sidesTotal deadlock, no clear control
Trend contextOften in consolidations or pauses

Stronger after a trend

(signals exhaustion)

Signal strengthWeak, requires context and confirmationStrong, potential reversal signal, especially post-trend
Confusion riskCommonly mistaken for DojiMistaken as “spinning top with no color”

Spinning Tops can also be mistaken for Hammers, Inverted Hammers, and Shooting Stars. Those have different meanings.

A Hammer has a small body at the top and a long lower wick. It forms after a downtrend and can signal a bounce. It means the price fell hard, but buyers pushed the candle’s body back up.

An Inverted Hammer is the opposite. It forms after an uptrend and has a small body near the bottom with a long upper wick.

A Shooting Star is basically an inverted hammer that forms after an uptrend rather than a downtrend. This can signal that the price has reached a top.

How to trade the Spinning Top pattern

Seeing a Spinning Top doesn’t mean it’s time to hit the buy or sell button. On its own, it’s just a pause. What makes it useful is the context it forms in. When it aligns with key technical tools like the Fibonacci retracement, a trendline, or the RSI, it can turn into a strong setup.

One of the most reliable strategies is to trade Spinning Tops that form near overbought or oversold RSI signals, while using major Fibonacci levels to time entries and exits, such as the 0.0% swing high and retracements like 38.2% and 61.8%.

Example: Spinning Top + Fibonacci + RSI on the USDJPY 4-hour chart

Example: Spinning Top + Fibonacci + RSI on the USDJPY 4-hour chart

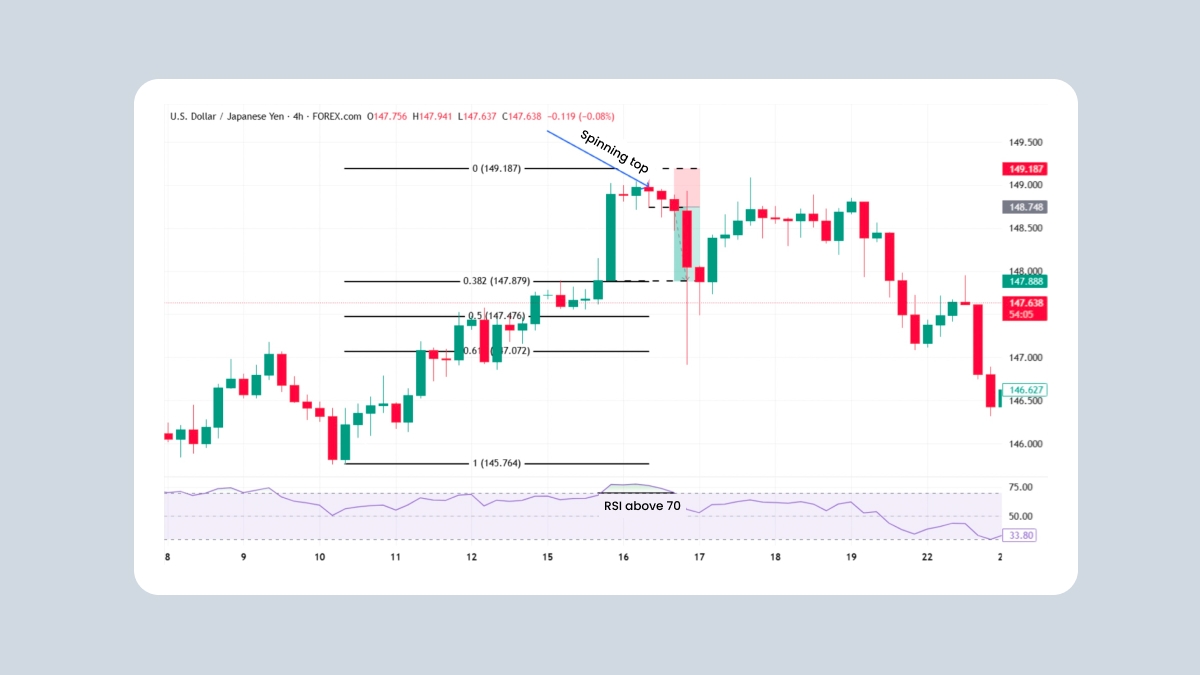
  1. In this example, the USDJPY pair rallies and reaches the 0.0% Fibonacci level, forming a top at the resistance level. That’s the first signal.

  2. A Spinning Top forms, signalling hesitation. This is your second signal.

  3. We can see that the RSI is above 70, which means the pair is overbought, and the volume is dropping, which is another warning sign that momentum is fading. This is the third signal.

  4. The next candle is red and breaks past the Spinning Top’s low. This is your confirmation signal, and can be your entry for a short trade.

Trade setup example:

  • Entry: Below the Spinning Top’s low.

  • Stop-loss: Above the Spinning Top’s high wick.

  • Take-profit: Fibonacci 38.2% retracement or nearest support level.

Trading with two or three confirmation signals can increase the probability that your setup is solid. Below is a list of strong confirmation signals to look out for when trying to trade Spinning Tops:

  • Break past the Spinning Top’s high or low

  • Trendlines

  • Overbought or oversold RSI

  • MACD crossing or diverging

  • Volume spike or drop

  • Fibonacci retracement or projection levels

  • Support and resistance levels

Taking screenshots when you trade Spinning Tops can be a helpful exercise. Over time, you’ll notice which conditions make them work and which ones don’t. The most reliable Spinning Tops tend to show up after extended moves. If the market’s been climbing for days and then you see a Spinning Top, that’s more meaningful than if you see one right after a random two-candle bounce. Also consider zooming out. A Spinning Top on the 1-hour chart that lines up with a support level on the daily chart gives you a lot more confidence than one floating in the middle of nowhere.

Another useful exercise is to go through historical charts and look for Spinning Tops at major highs or lows. Once you spot them, check what happened next: did the price reverse or continue? What did the volume do? This can help you build intuition when deciding whether a Spinning Top is just noise or a real signal.

Common mistakes when trading Spinning Tops

1. Trading a Spinning Top without confirmationIt’s a mistake to trade a Spinning Top on its own. If you jump in just because you see one, you're basically guessing. It’s important to wait for the next candle to confirm the direction. If there’s no follow-through, don’t treat it as a signal.

2. Ignoring contextContext is everything. A Spinning Top inside a choppy sideways zone tells you very little. If it’s at the end of a strong move or at a major technical level, then it can mean something. Always take the price trend, levels, and structure into account.

3. Mistaking it for other candlesIt’s easy to mistake a Spinning Top for a Doji, Hammer, or a Shooting Star. Each pattern has a different structure and message. You can learn about each shape and practice identifying them on real charts.

4. Rushing your entryAnother mistake is making rushed trades. Patience is key. Let the market show you where it’s going. The Spinning Top itself isn’t your signal. The confirmation you see afterwards, such as a solid breaking past of the high or low, is what you should act on.

Final Thoughts

A Spinning Top is not a signal by itself. It’s more like a warning sign that something may be changing, but nothing is clear yet. It tells you the market’s unsure. But when this candle appears at the right spot, like a strong trend’s exhaustion point, a key Fibonacci level, or a major support or resistance level, and when it gets backed up by indicators or momentum shifts, it can turn into a reliable clue.

You can treat a Spinning Top like the piece of a larger puzzle to help you find the right timing for entries and exits with more confidence. If you ignore the context and confirmation, however, it will just be another random candle on the chart. A good start can be to practice spotting them and to see what happens after they appear. Doing so is also a good way to build trading confidence. Always study them by taking the rest of the chart and context into consideration. While they are a lot more subtle than other candlestick patterns, Spinning Tops can be valuable clues for timing trades when they’re backed up with other data.

Share with friends:

Open an FBS account

By registering, you accept FBS Customer Agreement conditions and FBS Privacy Policy and assume all risks inherent with trading operations on the world financial markets.

FBS at social media

iconhover iconiconhover iconiconhover iconiconhover icon

Contact us

iconhover iconiconhover iconiconhover iconiconhover icon
store iconstore icon
Get on the
Google Play
store iconstore icon
Get MT4 on the
App Store
store iconstore icon
Get MT5 on the
App Store

Trading

Company

About FBS

Our social impact

Legal documents

Company news

FC Leicester City

Help Center

Partnership programs

The website is operated by FBS Markets Inc.; Registration No. 000001317; FBS Markets Inc. is registered by the Financial Services Commission under the Securities Industry Act 2021, license number 000102/31. Office Address: The Bentley, #16 Cor A Street & Princess Margaret Drive, Belize City, Belize.

FBS Markets Inc. does not offer financial services to residents of certain jurisdictions, including, but not limited to: the USA, the EU, the UK, Israel, the Islamic Republic of Iran, Myanmar.

Payment transactions are managed by HDC Technologies Ltd.; Registration No. HE 370778; Legal address: Arch. Makariou III & Vyronos, P. Lordos Center, Block B, Office 203, Limassol, Cyprus. Additional address: Office 267, Irene Court, Corner Rigenas and 28th October street, Agia Triada, 3035, Limassol, Cyprus.

Contact number: +357 22 010970; additional number: +501 611 0594.

For cooperation, please contact us via [email protected].

Risk Warning: Before you start trading, you should completely understand the risks involved with the currency market and trading on margin, and you should be aware of your level of experience.

Any copying, reproduction, republication, as well as on the Internet resources of any materials from this website is possible only upon written permission.

The information on this website does not constitute investment advice, a recommendation, or a solicitation to engage in any investment activity.