June 18, 2025
Strategy
The Triple Screen Trading Strategy
Beginner traders often look for a magic tool––a single indicator that will help them make big profits. They may get lucky for a while, but eventually, the magic disappears. When losses kick in, they tend to think the reason is they had the wrong indicator. So they go for another one, and the same thing happens.
Needless to say, this is the wrong approach. It is based on a misunderstanding of the nature of indicators. None of them is designed to make a flawless interpretation or predict the market. Moreover, none of them is designed to correlate with other indicators. They are meant to be used in combination, including in situations when they contradict each other.
Alexander Elder is a well-known trader, famous for releasing several books on trading strategies. He invented the Triple Screen strategy - an approach that combines various indicators and filters out their disadvantages, while preserving their strengths. In a nutshell, it provides a three-tier approach to making a trade decision.
General
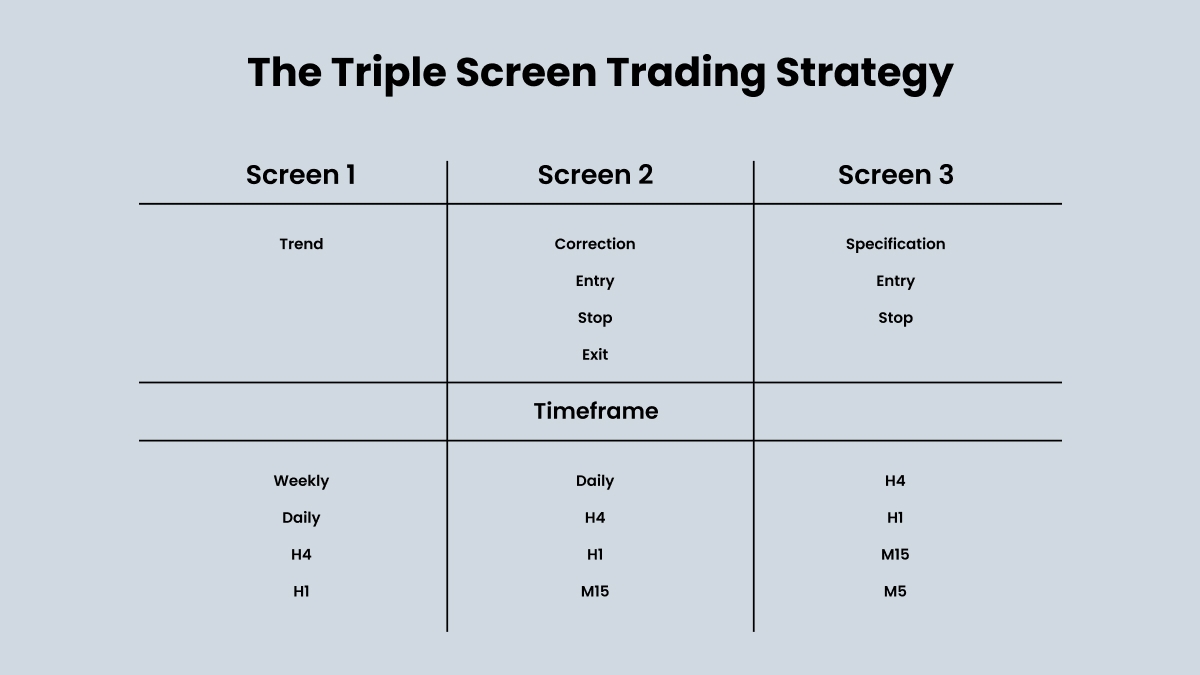
First, you decide what timeframe you want to trade on. Whichever one it is, you will have two more timeframes to look at in relation to the chosen one: a higher one, which provides a greater context of the market, and a lower one, which provides a detailed view of the current situation and gives you a chance to choose a precise entry point.
For example, if you want to trade intraday, you may choose the H1 chart as the main observation field, the H4 to see the greater market context, and the M15 timeframe for the entry point specifications. Each will be reflected in one of the three screens, as the table below shows.
The first screen
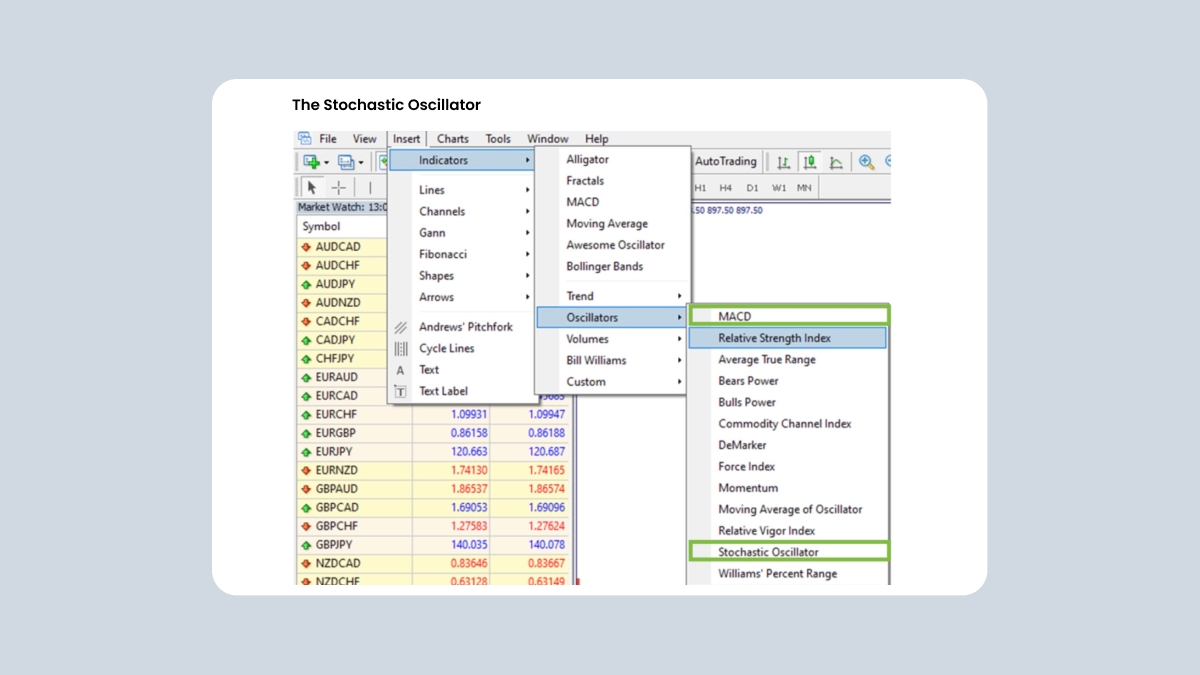
Suppose you want to make some trades with platinum. You open three charts: H4, H1, M15. On the H4 chart of platinum, we notice that the price has dropped, then entered a correction area. Based on this, we assume that it will go further up for a while within this correction course. Therefore, our idea will be to buy now, and sell when the price reaches higher levels. Now we want to verify our observation and cross-check it against various indicators. For this purpose, we open the indicators menu and attach the MACD and the Stochastic Oscillator (the below image shows how to do that).
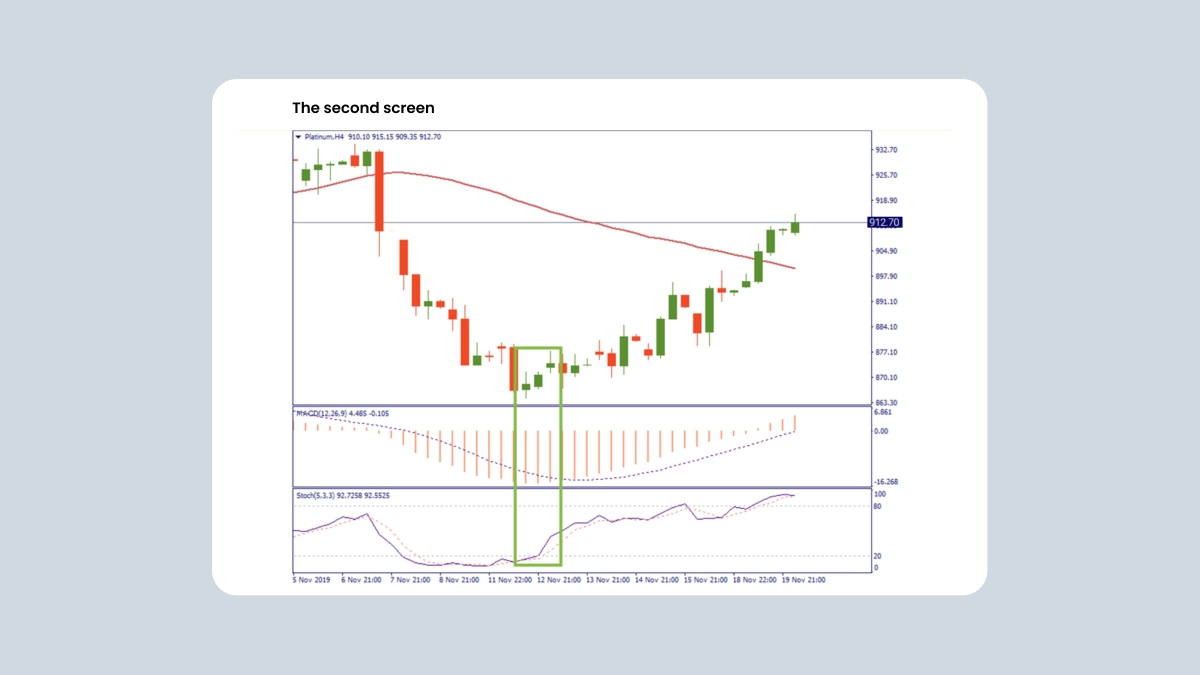
We see that the MACD has reached the extreme low below the signal line (the selected area on the image below). While the Stochastic Oscillator shows the fast (solid) line crossing the slow (punctured) line bottom-up within the 0-20% zone. Both are normally interpreted as signs of an oversold market and a signal to buy. Thus, we now have confirmation from two indicators that our market interpretation is likely correct and our strategy has a high chance of being successful. Now, we proceed to the second screen.
The second screen
The second screen serves to reconfirm the observation made on the first screen and provide a more precise entry area. To do that, we add the RSI to the chart window. The below image shows how to select it.
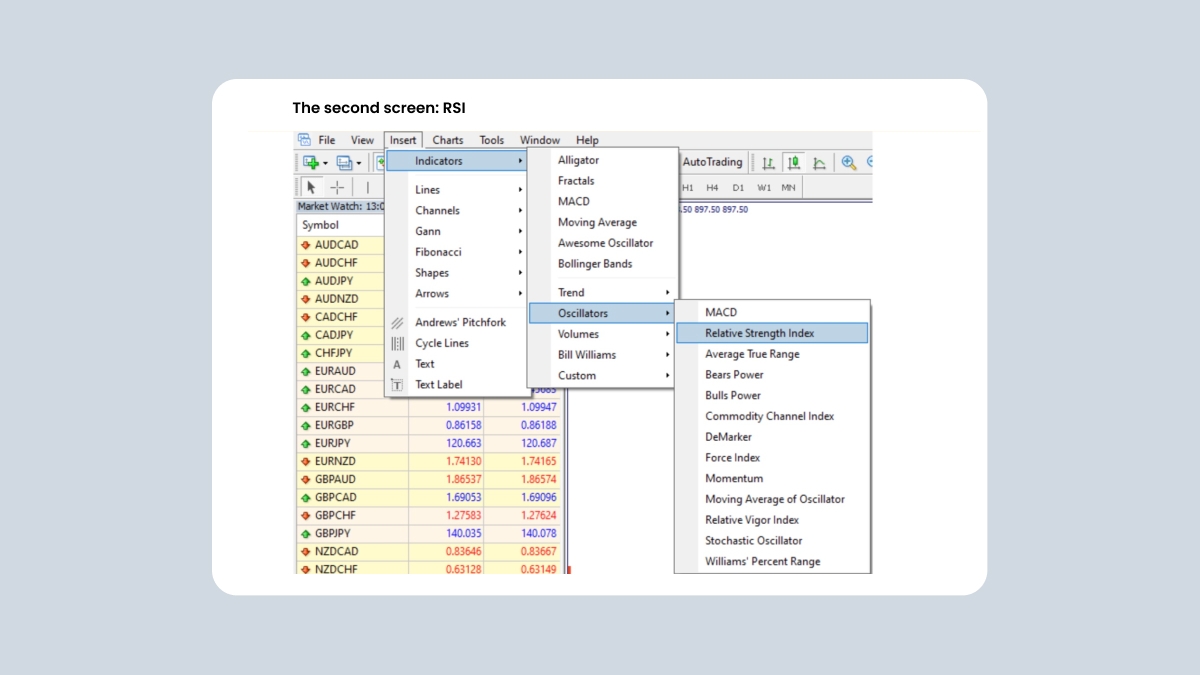
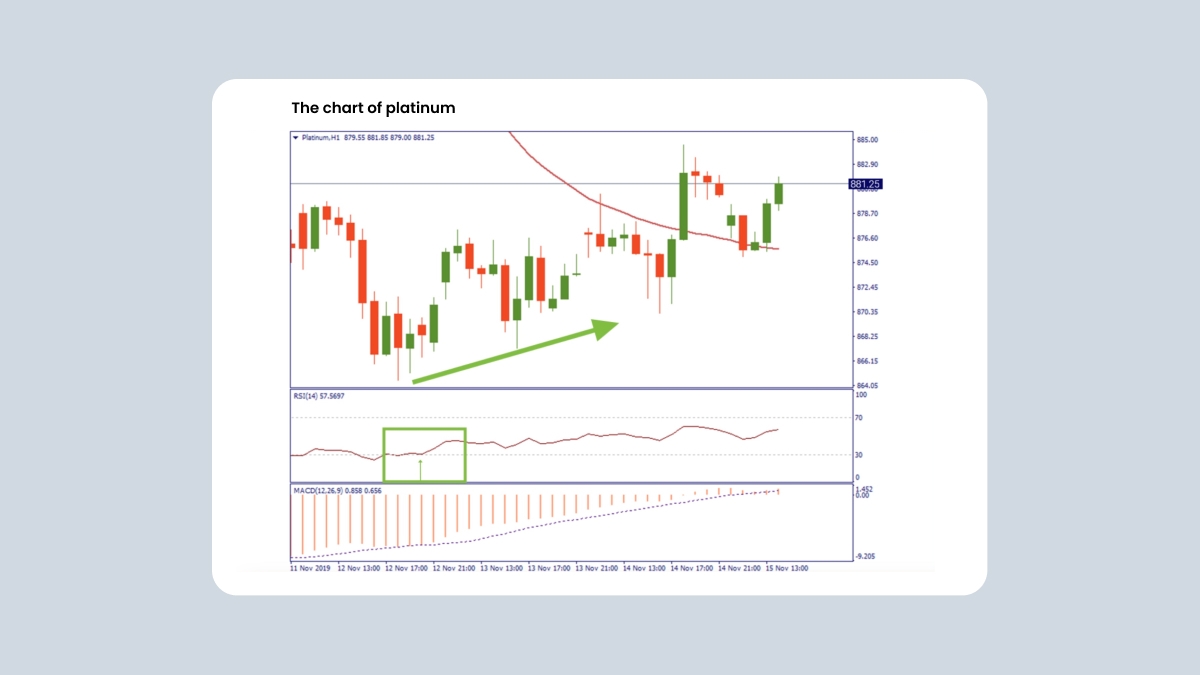
The RSI is a good tool, giving a fairly precise indication of the market’s strength and the moments where it is safe to open a position. As we are planning to buy on a rising correction trend, we will try to catch a good moment to open a long position. The RSI crossing the 30% shows us exactly that moment. On the H1 chart of platinum, we see that it has crossed the oversold level. That means the bullish push of the market is pretty strong. We now proceed to the third screen to pick the level to open longs.
The third screen
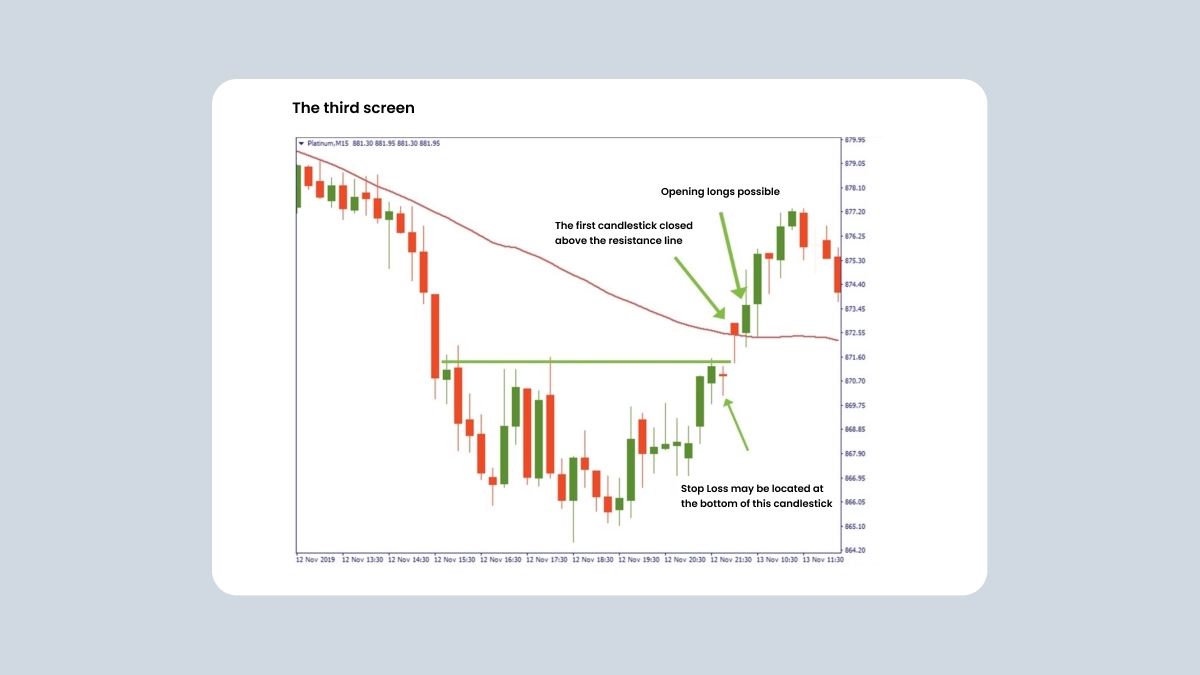
The third screen does not necessarily require any indicator. On the M15 chart of platinum, we see in detail the wave that was indicated as an entry area on the previous chart. We just want to reconfirm now that there will be no sudden downward reversal to invalidate our market correction assumption. We wait for the price to rise above the indicated level along with the 50-period Moving Average. That is a signal for us to buy. We may open a long position right after the first candlestick closes above the resistance line, locating the stop-loss at the bottom of the previous candlestick down.
Summary
The observed example provides a strategy for the local uptrend following a general downtrend. You try to “ride the wave” - on the falling market, buy at the low and sell at the high of each cascade. The vice versa scenario would likewise work for a rising market.
Traders may ask: what if the price acts differently compared to what we predicted?
Our answer is: there is no perfect trading methodology. If a trader wants to apply this approach, it is their duty to perfect it and be able to identify situations where it is applicable. Conversely, the trader must also understand the exact scenarios where this trading strategy is inapplicable. The idea of this strategy is simple: apply several filters to your decision making and use various indicators when making your trades.