Open account
Open accountLog In
Open account

Aug 22, 2025

Strategy

What Is The Traders Dynamic Index or TDI Indicator?

In this article
TDI Indicator

In trading, the right tools can help you make better choices. Some tools show momentum, others highlight trends, and some show how much the market is moving. But what if you could see all of that in one place?

In this guide, you’ll discover the TDI, an indicator that gives a full view of market conditions in real time. You’ll learn how it works and how to use it to trade more confidently.

What is the Traders Dynamic Index (TDI)?

The TDI (Traders Dynamic Index) is a trading tool that combines three indicators in one:

Indicator

Function

Relative Strength Index (RSI)

Shows market momentum

Moving averages

Show the overall trend

Volatility bands (like Bollinger Bands)

Track how much the market is moving up or down

As shown in the table above, each indicator has its own purpose. The TDI allows traders to see momentum, trends, and volatility all in one chart. This makes it easier to quickly spot trends and overall market conditions without switching between multiple indicators.

The TDI was created for the Synergy trading method, but later became popular in its own right. Join FBS today and try it in your own trades.

How the TDI works

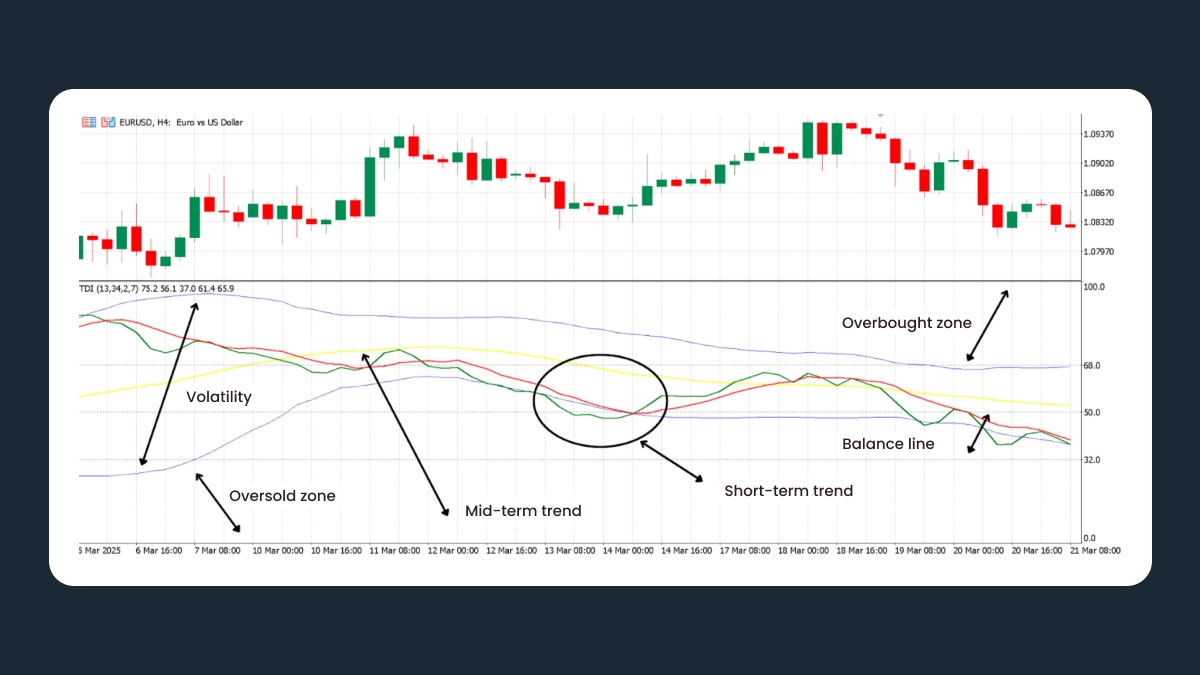
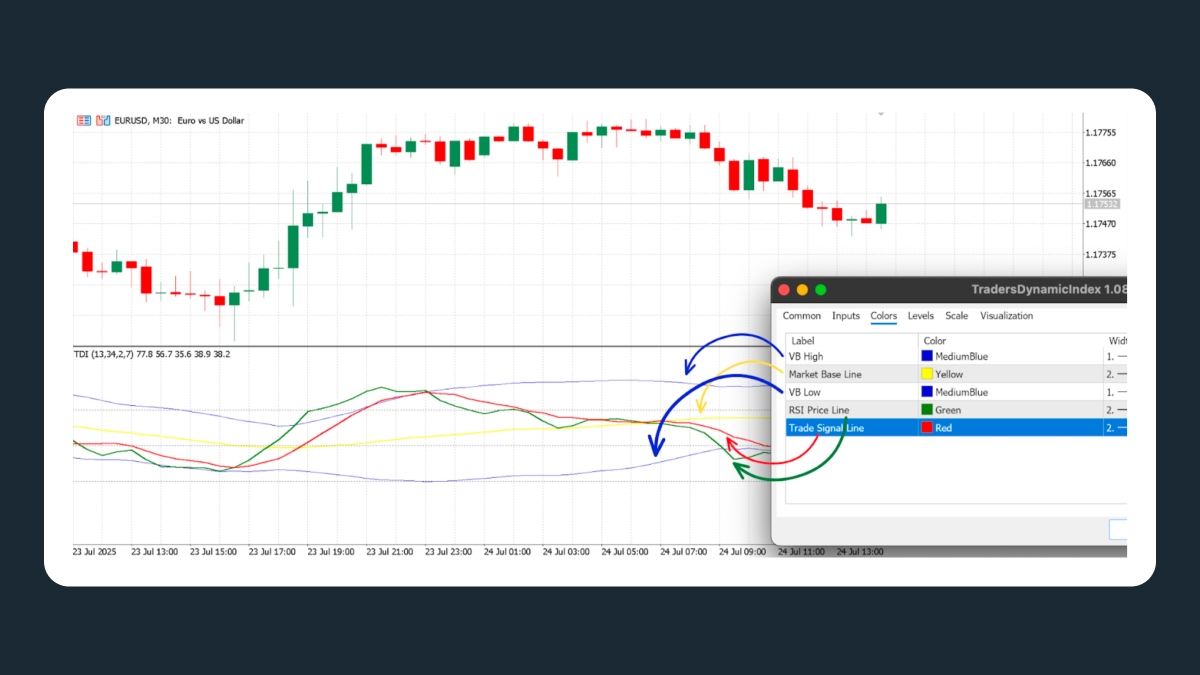
The Traders Dynamic Index (TDI) has four main parts, as shown in the image below:

How the TDI works

  1. The green line is the RSI price line, which shows short-term market strength.

  2. The red line is the signal line, which smooths the green line to reduce noise and show trend direction.

  3. The blue lines are the volatility bands, which show when the market is tightening, expanding, or hitting extreme highs/lows.

  4. The yellow line is the market base line, which shows the overall trend.

Traders use the TDI to spot when all signals agree (stronger setups) or when they don’t (possible reversals).

Key settings and platforms (MT4/MT5)

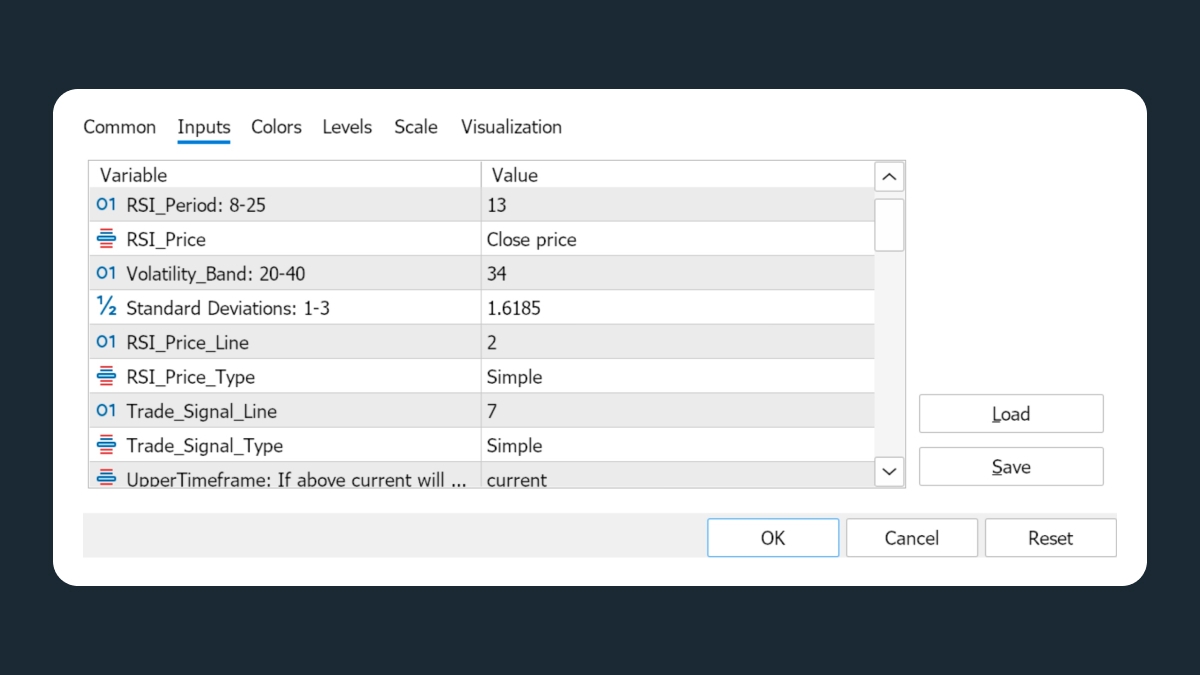
On MetaTrader 4 (MT4) and MetaTrader 5 (MT5), the TDI is available as a custom indicator. The default settings are:

  • RSI period of 13 (applied to the close price);

  • Volatility bands using a 34-period Bollinger Band;

  • Standard deviation of 1.618;

  • Signal Line smoothing of 2 (SMA of the RSI Price Line);

  • Moving average type is usually simple (SMA, RSI_Price_Type).

Changing these settings will make the indicator react faster or slower. For example:

Scalpers

They often lower the RSI period for quicker signals.

Swing traders

They often raise the RSI period for smoother trends.

You can also adjust these settings for long-term trading. Many traders use the TDI together with price action to confirm setups and avoid false signals.

How to read TDI signals

How to read TDI signals

Knowing how to read the TDI helps you find good trade opportunities. But do not use it as the only reason to enter or exit a trade. It’s most useful in conjunction with other tools, to help you understand market context. Below, you’ll find out how to interpret its signals step by step.

Identifying trend direction

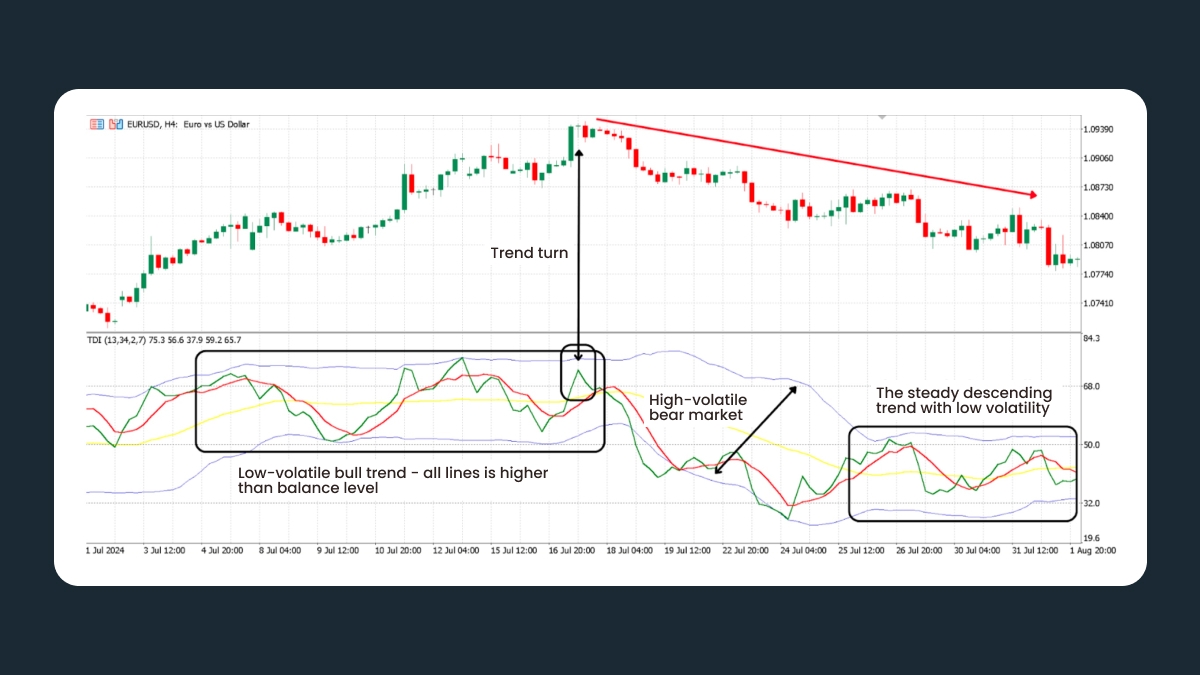
The TDI shows if the market is trending or moving sideways by looking at the positions of the main lines: the RSI price line (green), the signal line (red), and the market base line (yellow).

Identifying trend direction

Here’s a simple guide to reading the signals:

Condition

Interpretation

Meaning

Green above red

Short-term bullish pressure

Buyers in control

Green below red

Short-term bearish pressure

Sellers in control

Red above yellow + both moving up

Strong bullish trend

Market moving upward strongly

Red below yellow + both moving down

Strong bearish trend

Market moving downward strongly

Yellow tilts up + red above yellow

Bulls in control

Overall upward trend

Yellow tilts down + red below yellow

Bears in control

Overall downward trend

Green and red flat near yellow

Consolidation

Sideways market

The yellow line (MBL) shows the overall trend and usually moves between 32 and 68.

Measuring momentum and volatility

In the TDI, momentum is shown by the slope of the green RSI price line:

  • A steep upward slope means strong buying pressure.

  • A steep downward slope means strong selling pressure.

  • Gentle slopes suggest weak momentum and a possible sideways market.

The red signal line smooths these moves so traders don’t react to short-term spikes.

Volatility is shown by the width of the blue Bollinger Bands:

  • Wide bands mean the market is active with bigger price swings.

  • Narrow bands mean low volatility and calmer conditions.

  • When the bands widen and the green line moves sharply in one direction, volatility is rising and the trend will likely continue.

  • Narrow bands with a choppy green line often mean the market is flat or waiting for news.

The closer the green line is to 50, the more neutral the market.

Flat TDI lines usually appear during quiet trading hours or right before major economic events, when signals are less reliable. Try spotting these moments in a free FBS demo account and practice risk-free.

Spotting overbought/oversold zones

Spotting overbought/oversold zones

The TDI uses the green RSI line to show when the market might be too high (overbought) or too low (oversold):

Overbought

If the green line goes above 68 and then reverses down, the market might fall. This signal is stronger if it also goes above the top blue Bollinger Band.

Oversold

If the green line goes below 32 and then reverses up, the market might rise. This signal is stronger if it also goes below the bottom blue Bollinger Band.

These signals aren’t instant trade triggers. In strong trends, the market can stay overbought or oversold for a long time, so treat them as zones of interest and combine them with price action or support/resistance to time better entries.

TDI trading strategies

TDI trading strategies

Basic Crossover

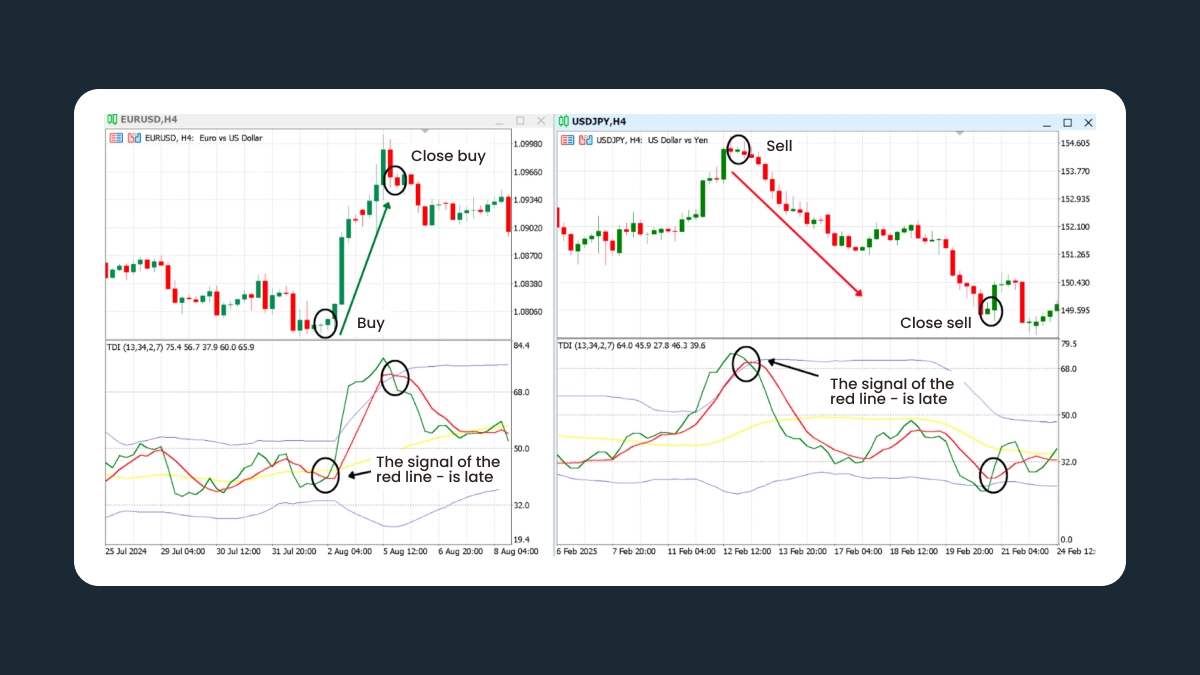
This is one of the most common approaches. In this strategy, traders enter long when the green RSI price line crosses above the red signal line, and enter short when it crosses below.

The slope and position of these lines compared to the yellow market base line help confirm the trend’s direction. Many traders exit on the opposite crossover or during a spike in volatility.

The Basic Crossover Strategy works best in trending markets, so it’s often paired with higher timeframes to reduce noise.

Volatility Breakout

This strategy is applicable when the Bollinger Bands tighten, showing low volatility. When the green and red lines break out together, it can signal a strong price move.

The Volatility Breakout works especially well on 15-minute to 1-hour charts.

Trend Continuation

The Trend Continuation strategy looks for the green line to bounce off the red or yellow line while moving in the same direction as the overall trend.

The slope of the MBL and candle patterns helps confirm the setup.

Divergence Reversals

The Divergence Reversals strategy focuses on differences between price action and the TDI:

  • If the price makes a new high but the RSI line doesn’t, it can signal a bearish reversal.

  • If the price makes a new low but the RSI doesn’t, it can signal a bullish reversal.

This strategy often combines a green/red crossover with easing Bollinger Band pressure. It works best when confirmed with other technical tools like support/resistance or candlestick patterns.

Limitations and common pitfalls

Like any indicator, the TDI is not a guarantee of profitable trades and comes with its own limitations. For example, in sideways or choppy markets, the green and red lines can cross many times, giving false signals (especially on lower timeframes). Also, because it’s a smoothed indicator, it can react slowly when the market moves fast.

Other limits include the fact that it doesn’t use volume data like OBV or VWAP (only price action). Changing the settings too much can make backtest results look impressive but fail in live trading.But don’t worry! These risks can be managed. To do this, add some fundamental analysis and use good risk management (like stop-loss orders and the right position size).

The TDI works best when it is part of a full trading plan that looks at the whole market picture.

Practical tips for using the TDI effectively

Here are some simple tips to help you use the TDI more effectively:

  • Combine it with support/resistance, moving averages, or volume to confirm signals.

  • Look for agreement with price action patterns (inside bars, pin bars, Fibonacci retracements).

  • Check higher timeframes to confirm the main trend.

  • Focus on one setup first (for example, a bounce strategy with a trendline) before adding more strategies.

  • Avoid trading only on TDI during big news events like NFP, CPI, or FOMC.

  • Practice on a demo account before using real money to build confidence and consistency.

Turn TDI signals into profits with FBS

The TDI puts three key tools into one (momentum, trend, and volatility). This helps traders spot good opportunities without switching between many charts. With a clear view of the market and simple trading rules, it can make timing easier and build trading confidence.

When used the right way, the TDI is a great partner for smarter and more disciplined trading. You can find this and many other cutting-edge indicators when trading with FBS, helping you discover better setups and make confident decisions.

Share with friends:

Open an FBS account

By registering, you accept FBS Customer Agreement conditions and FBS Privacy Policy and assume all risks inherent with trading operations on the world financial markets.

FBS at social media

iconhover iconiconhover iconiconhover iconiconhover icon

Contact us

iconhover iconiconhover iconiconhover iconiconhover icon
store iconstore icon
Get on the
Google Play
store iconstore icon
Get MT4 on the
App Store
store iconstore icon
Get MT5 on the
App Store

Trading

Company

About FBS

Our social impact

Legal documents

Company news

FC Leicester City

Help Center

Partnership programs

The website is operated by FBS Markets Inc.; Registration No. 000001317; FBS Markets Inc. is registered by the Financial Services Commission under the Securities Industry Act 2021, license number 000102/31. Office Address: The Bentley, #16 Cor A Street & Princess Margaret Drive, Belize City, Belize.

FBS Markets Inc. does not offer financial services to residents of certain jurisdictions, including, but not limited to: the USA, the EU, the UK, Israel, the Islamic Republic of Iran, Myanmar.

Payment transactions are managed by HDC Technologies Ltd.; Registration No. HE 370778; Legal address: Arch. Makariou III & Vyronos, P. Lordos Center, Block B, Office 203, Limassol, Cyprus. Additional address: Office 267, Irene Court, Corner Rigenas and 28th October street, Agia Triada, 3035, Limassol, Cyprus.

Contact number: +357 22 010970; additional number: +501 611 0594.

For cooperation, please contact us via [email protected].

Risk Warning: Before you start trading, you should completely understand the risks involved with the currency market and trading on margin, and you should be aware of your level of experience.

Any copying, reproduction, republication, as well as on the Internet resources of any materials from this website is possible only upon written permission.

The information on this website does not constitute investment advice, a recommendation, or a solicitation to engage in any investment activity.