Trading can feel confusing with so many tools around. But some are easy to use and really effective. The Donchian Channel is one of them! It’s widely used by traders who want a clear view of price action and momentum.
In this article, we’ll see what the Donchian Channel is, why traders rely on it, and how it can bring more clarity to trading decisions. Let’s dive in!
What Is the Donchian Channel indicator?
The Donchian Channel is a trading tool created by Richard Donchian, often called the “father of trend-following.” It shows the highest and lowest prices over a set time. Sometimes it also adds a middle line, which is just the average of the two.
The tool helps spot when the price is expanding or tightening. It doesn’t predict what will happen next, but it gives clear signs of momentum shifts and possible entry or exit points. It also shows how much the market is moving, when a breakout could happen, and the direction of the trend.
How it works: Formula and calculation
The Donchian Channel is built with three lines that help Forex traders see market direction, possible breakout points, and pullbacks. Each line has a clear role:
Channel | How it’s calculated | What it shows |
Upper channel | Highest price in the last N candles | A close above it suggests bullish strength |
Lower channel | Lowest price in the last N candles | A close below it shows bearish momentum |
Middle line | (UC + LC)/2 (average of the two) | Trend guide, pullback level, or trailing stop |
The period (N) is flexible. It can be minutes, hours, days, weeks, or months, depending on your trading style. The most common setting is 20 days, since that’s about the number of trading days in a month.
By changing the period length, the Donchian Channel can be used for quick scalping, swing trading, or long-term trend following.
Types of Donchian strategies
There are different ways to trade with the Donchian Channel, and each one depends on how the price reacts to the channel lines. Check out the main types of Donchian strategies below:
1. Donchian Channel breakout
This is a strategy that works best in strong trends, like after news, economic reports, or sudden spikes in volatility.
A common approach is to buy when the price closes above the upper band and sell when it closes below the lower band.
Avoid using it in slow, low-volatility markets. Breakouts in these trading conditions often fail quickly and create false signals instead of strong moves.
Test this strategy in real market moves! Join FBS now and take your first step into the market.
2. Pullback re-entry
After a breakout, wait for the price to pull back toward the middle line or retest the broken band before entering. This often provides a better risk–reward than jumping in right at the breakout.
Always look for confirmation. For example, use candlestick patterns like a Pin Bar or an Engulfing Candle, or indicator signals such as a MACD crossover that validate the entry.
3. Trend filter with higher timeframe
Use the Donchian Channel on a higher timeframe (like H4) to see the main market direction. Then, on a lower timeframe (like M15), only take breakout signals that go in the same direction as that bigger trend. This helps avoid countertrend trades and reduces false breakouts.
For example, if the H4 channel shows an uptrend and the price is staying near the upper band, you should only take long breakouts above the upper band on M15 and ignore short signals.
How to use the Donchian Channel in trading
It’s not just about spotting a breakout. To trade it well, you need simple rules for entry, stop-loss, take-profit, and even confirmation tools. Below is an easy step-by-step guide that shows how to apply it in practice:
Entry
Wait until the candle fully closes outside the channel, not just a quick wick. This helps confirm real momentum, especially on higher timeframes.
Stop-loss
Place your stop-loss just beyond the opposite band or behind the last swing high/low. This protects your trade and helps avoid quick stop hunts.
Another easy way is to use a fixed stop, like -10% from your entry price, so you always control how much of your account you risk (in this case, no more than 10% per trade).
Take-profit
You can take profit in a few simple ways:
Use a fixed risk-to-reward ratio (like 1:2 or better).
Move your stop along the opposite band to lock in gains.
Exit when the price closes at a set Donchian low/high (for example, close a long if the price closes at a 10-period low).
Use the middle line or opposite band as visual guides to plan your exit.
Confirmation tools
Don’t rely solely only on the Donchian Channel breakout. Combine it with other signals to confirm strength, such as:
Volume spikes
RSI direction
MACD crossovers
Relying only on a channel breach can be risky. Use context to filter out false moves and practice first with an FBS demo account before trading live.
Timeframes
The Donchian Channel can be used on different period settings. Each choice has its own pros and cons. Here’s a quick look at how shorter and longer setups compare in practice:
Real-world example
In a real example, when the price breaks above the Donchian upper band, it shows strong buying pressure and confirms a bullish breakout. The entry is made at the open of the next candle, after the breakout candle closes, to confirm momentum and avoid false signals.
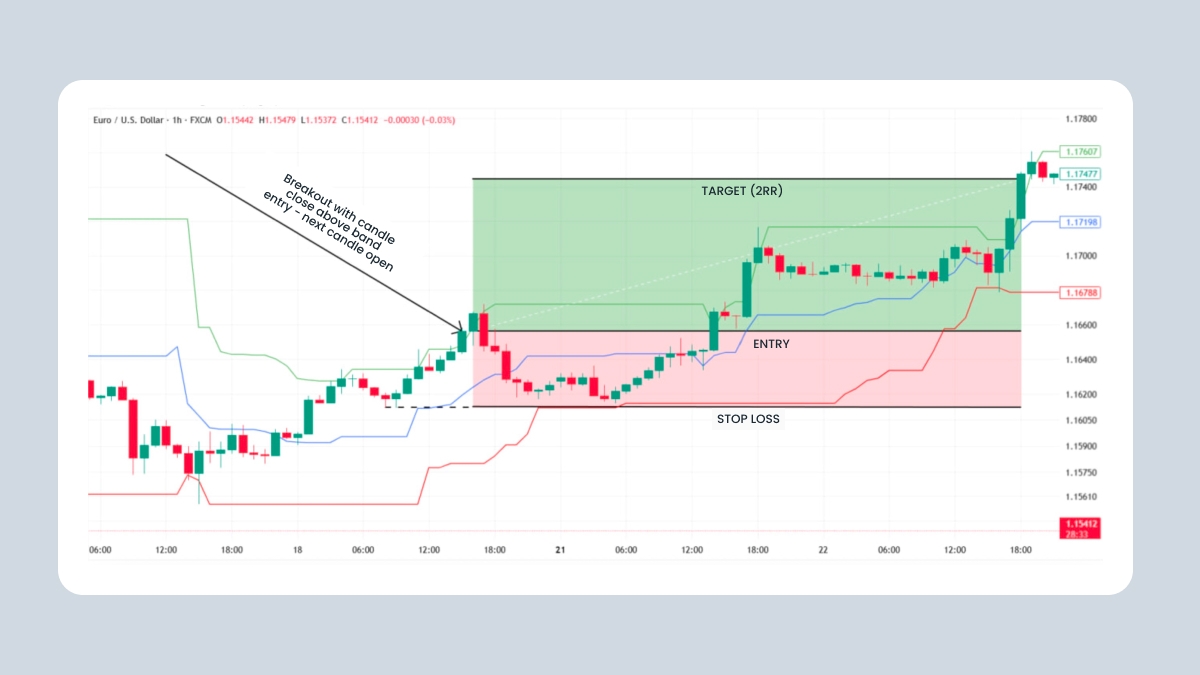
Notice how the stop-loss is set just below the last swing low, inside the lower band, for solid protection against market noise. The take-profit is placed at twice the stop distance, giving a simple 1:2 risk-to-reward ratio and removing guesswork.
MT4/MT5 setup and best settings
The best settings for using the Donchian Channel are:
20-period (classic): Balanced for most markets; works well for intraday and swing trading.
55-period: Captures larger trends; popular for commodities such as gold.
10-period: Faster signals for scalping or early breakouts, but with more noise.
Pro tip: Always test the settings based on the asset’s volatility. For example, a 20-period works well on EURUSD, while a 55-period is often better for gold or other trending commodities.
Common pitfalls and how to avoid them
False breakouts
One of the most common issues happens when the price breaks above or below the band but then quickly pulls back, leading to failed entries. A frequent mistake is to ignore this risk.
To avoid making this error, wait for confirmation with higher volume, momentum indicators, or candlestick patterns before entering a trade.
Lagging by design
The Donchian Channel follows past highs and lows, so it cannot predict future moves. On fast charts, have you noticed that the breakout often shows up late, when the move has already started? This delay is the price you pay for its clarity. To deal with it, use the channel together with tools like RSI, MACD, or volume, or check higher timeframes to get more accurate signals.
Useless in ranges
In sideways or low-volatility markets, the price often just bounces between the bands with no clear direction. This creates noisy signals and repeated stop-losses.
Avoid overtrading in choppy conditions or add a trend filter to confirm setups.
Over-reliance on the indicator
A common mistake is to rely only on the Donchian Channel to trade. No single indicator should be used without looking at the bigger market picture and other factors.
To avoid this, check volume for strength, use trend indicators to confirm direction, and add momentum signals to filter out weak breakouts.
Neglecting risk management
Not every trade is profitable. If you skip setting stop-loss orders or trade with the wrong position size, losses can grow fast. Many traders fall into this trap by trusting the setup too much.
Always protect yourself with a stop-loss (best placed near the opposite band or behind a key swing point) and choose a position size that matches your account risk.
Period sensitivity
Another common mistake is using the same lookback period for every asset or timeframe. The Donchian Channel reacts differently depending on the setting.
Adjust the period to match the asset’s volatility and your trading style.