The DeMarker Indicator was invented and described by Thomas DeMark.
The basic principle is this: the intraday high of the current day is compared to the intraday high of the previous day. If the intraday maximum of the current day is higher, the corresponding difference is recorded. A zero value is recorded if the intraday maximum is less than or equal to the previous day's intraday maximum. Then the differences obtained in this way are summed. This value becomes the numerator of the indicator, which is divided by the same value plus the sum of differences between the price minima of the previous and current days.
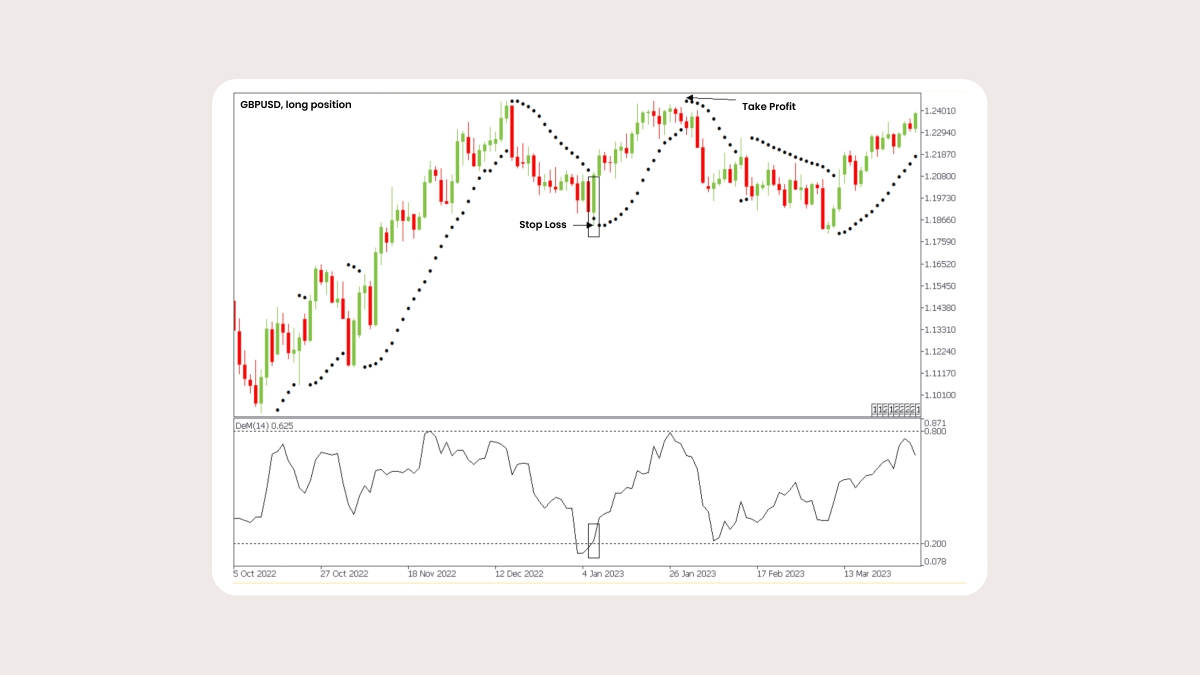
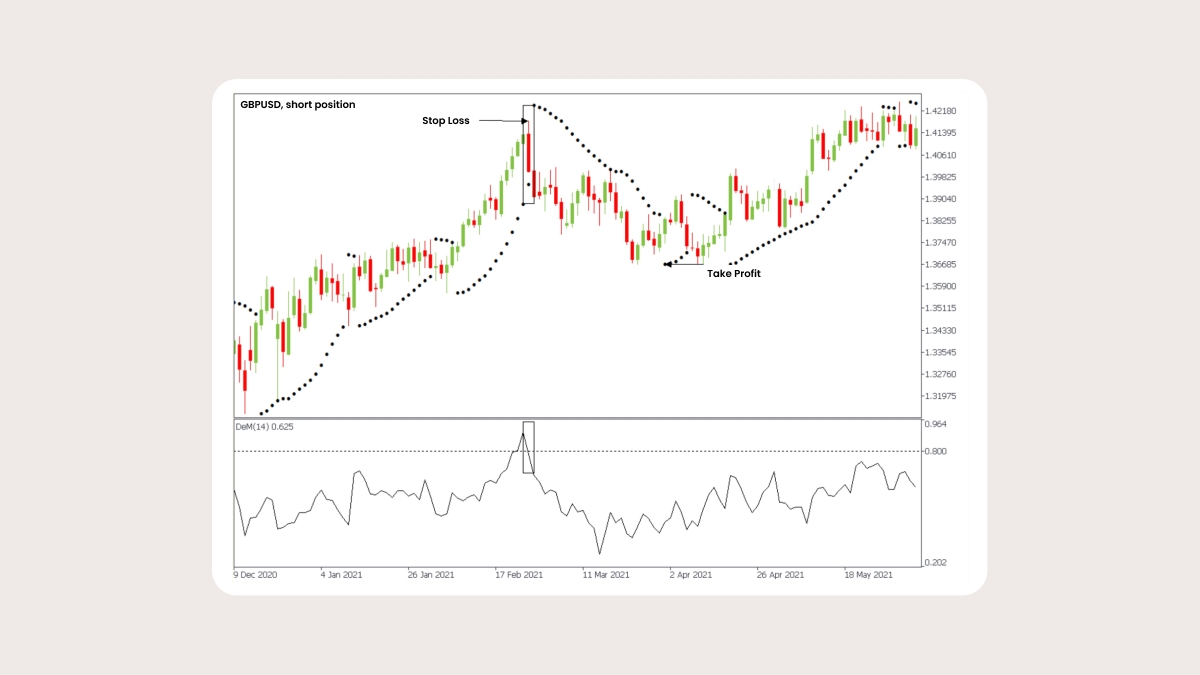
When the indicator is below its lower level – the price may reverse UP. When the indicator is above its upper level – the price may reverse DOWN.
Strategy Setups
Instruments: any
Indicators: DeMarker, Parabolic SAR
Settings: change the DeMarker levels to 0.2 and 0.8.
Timeframe: >30M
Rules for a long entry
Wait for the DeMarker line to break its LOWER line and return to the working zone.
Parabolic SAR should start rising, or at least should form the last point of the bearish trend.