Estrategia 1
Por ejemplo, supongamos que decidimos operar el par de divisas CADJPY.
Canadá es uno de los mayores productores de petróleo del mundo y un conocido exportador de esta materia prima. Por lo tanto, normalmente el dólar canadiense sube cuando los precios del petróleo aumentan. En contraste, Japón es considerado un importador neto de petróleo. Esto provoca que el yen se debilite cuando suben los precios del petróleo. Esta situación convierte a la dinámica de los precios del petróleo en un indicador líder para el movimiento del par CADJPY.
Concepto de la estrategia:
Temporalidad: Diaria
Configuración de una operación larga:
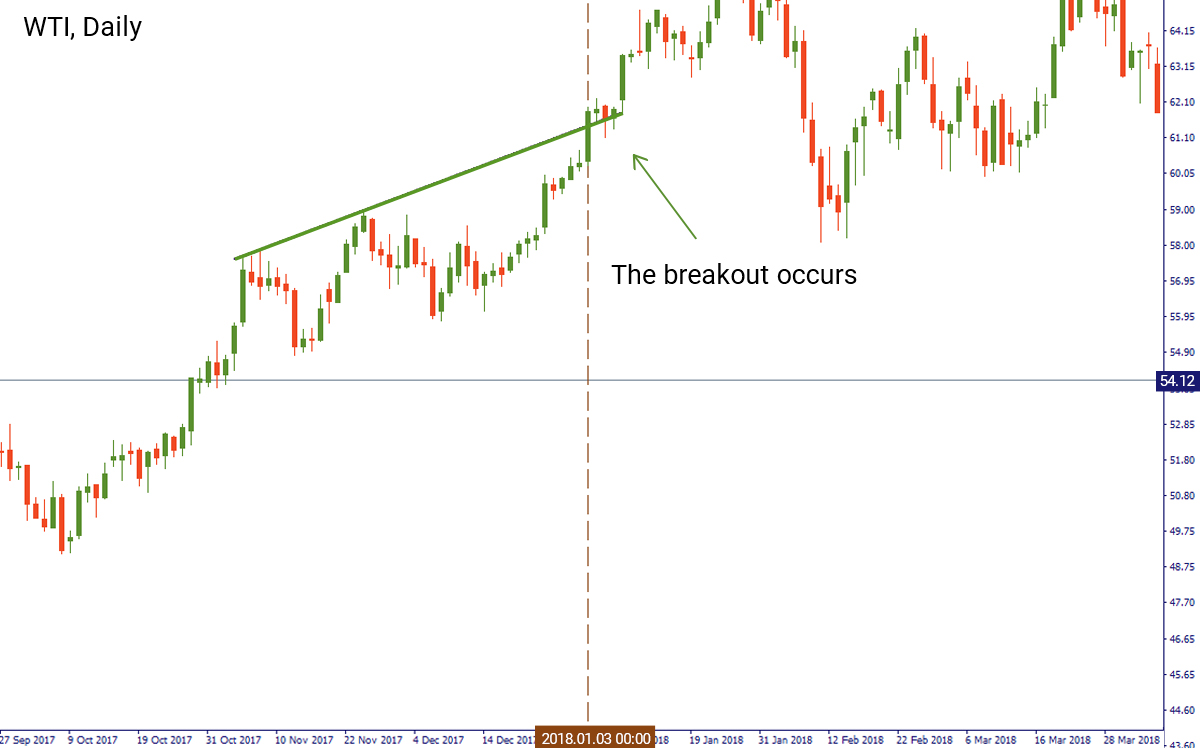
Primero, identifica la resistencia en el gráfico técnico diario de futuros de petróleo.
Encuentra una vela que se cierre por encima de la resistencia.
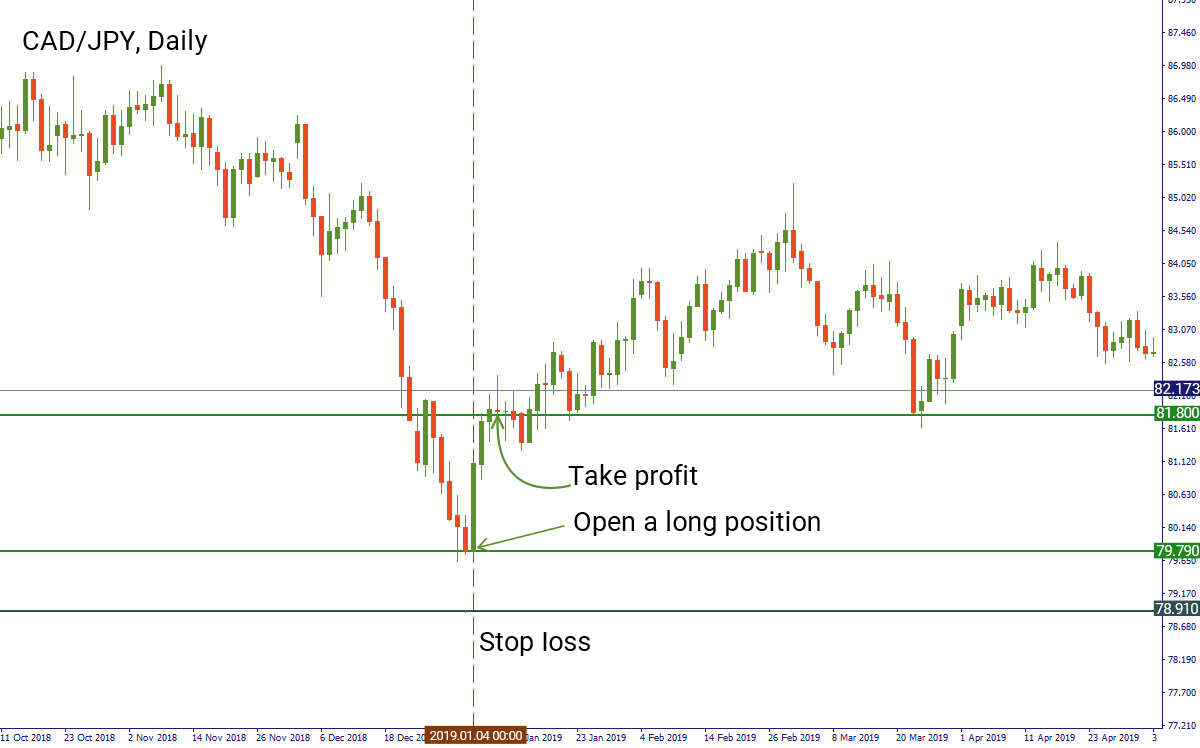
Abre una posición larga en CADJPY en cuanto se abra la siguiente vela.
Coloca un stop loss en el nivel de soporte significativo antes de la entrada.
Establece un take profit por debajo del siguiente nivel de resistencia significativo después de la entrada.
Ejemplo:
En el gráfico diario de WTI, identificamos una tendencia alcista y estábamos buscando un quiebre. La vela que cerró por encima de la línea de tendencia ocurrió el 3 de enero. Después de eso, el 4 de enero, abrimos una posición larga para CADJPY al precio de apertura de una vela en 79.79. Colocamos un stop loss en el nivel de soporte anterior en 78.91 y un take profit en 81.8.
Configuración de una operación corta
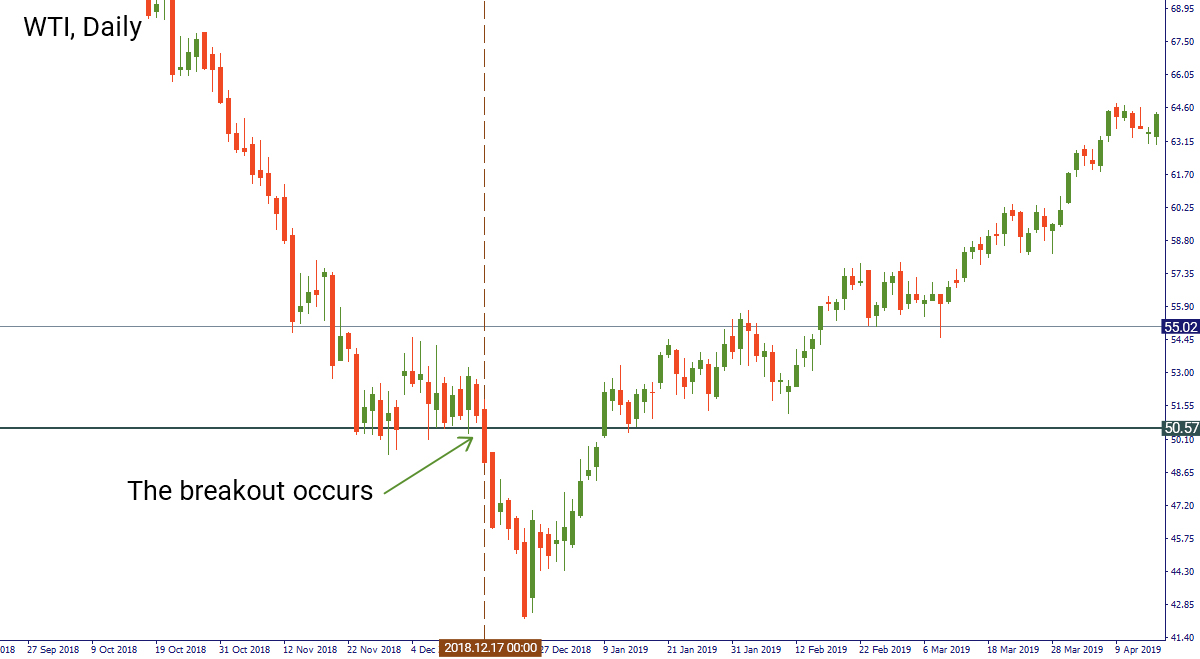
Identifica el soporte del gráfico de petróleo en la temporalidad diaria.
Encuentra una vela que se cierre por debajo del soporte.
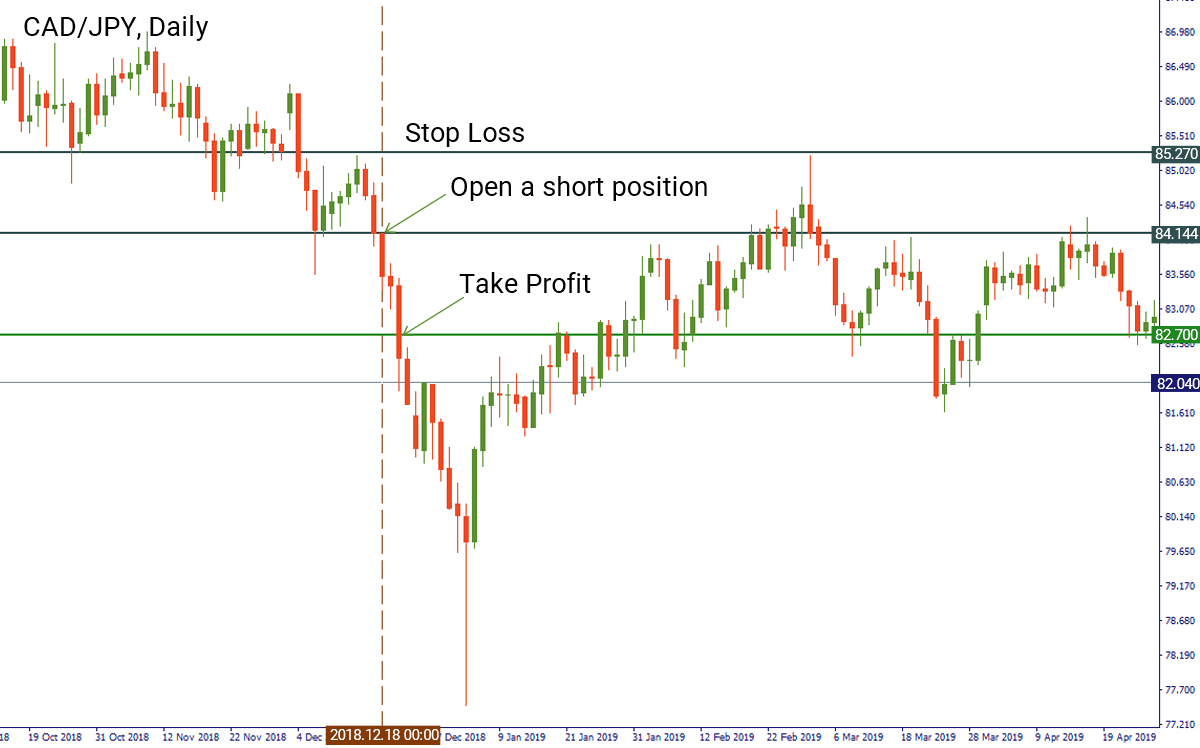
Abre una posición corta para CADJPY en la apertura de la siguiente vela.
Coloca un stop loss en el nivel de resistencia significativo antes de la entrada.
Establece un take profit por debajo del siguiente nivel de soporte significativo después de la entrada.
Ejemplo:
En el gráfico diario de WTI, el precio del crudo ha estado consolidando por encima del nivel de soporte en $50.57. Esperamos una ruptura de este nivel, la cual ocurrió el 17 de diciembre. Después de eso, cambiamos al gráfico de CADJPY. Colocamos una orden corta en el precio de apertura de la vela el 18 de diciembre en $84.14. El stop loss para esta posición estará situado en $85.27, mientras que el take profit estará en $82.7.
Estrategia 2
La estrategia que vamos a describir aquí explica la correlación negativa entre el índice dólar (el índice que mide el valor del dólar estadounidense en relación al valor de una canasta de divisas mayores) y el precio del oro. Como regla general, el índice dólar cae cuando el oro sube.
Concepto de la estrategia:
Temporalidad: Diaria
Configuración de una operación larga:
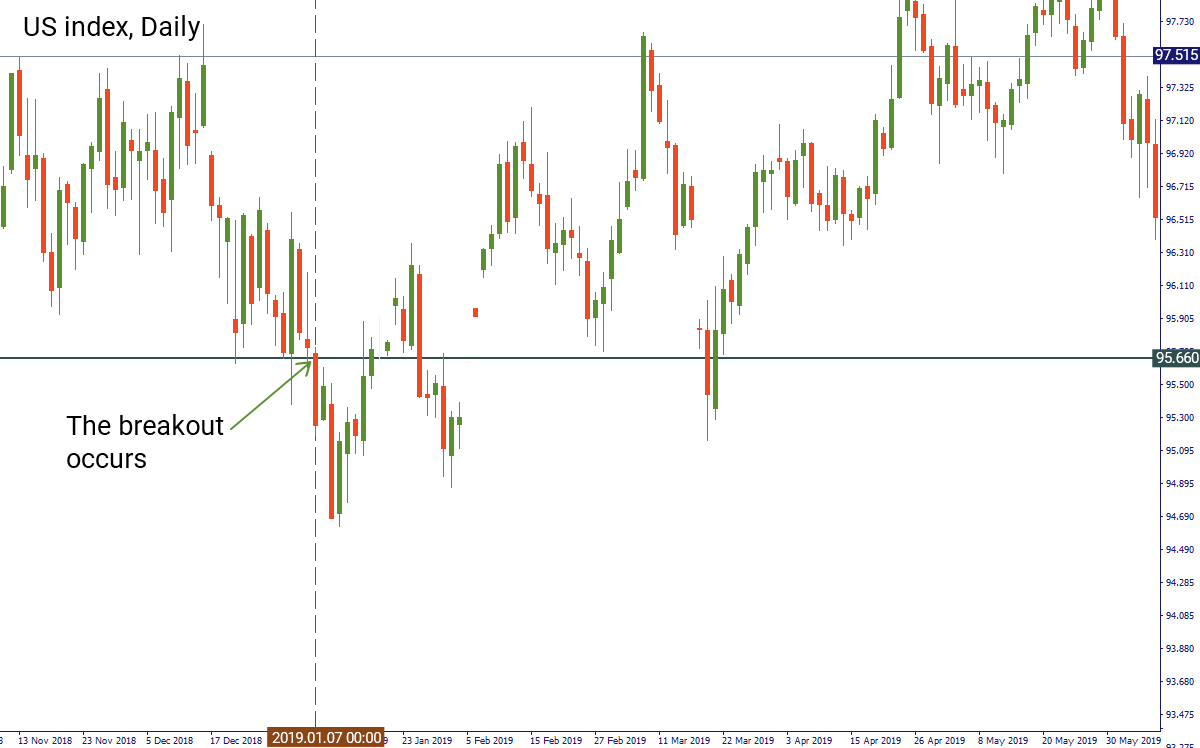
Identifica el nivel de soporte en el gráfico del índice dólar (temporalidad diaria).
Identifica una vela que se cierre por debajo del soporte.
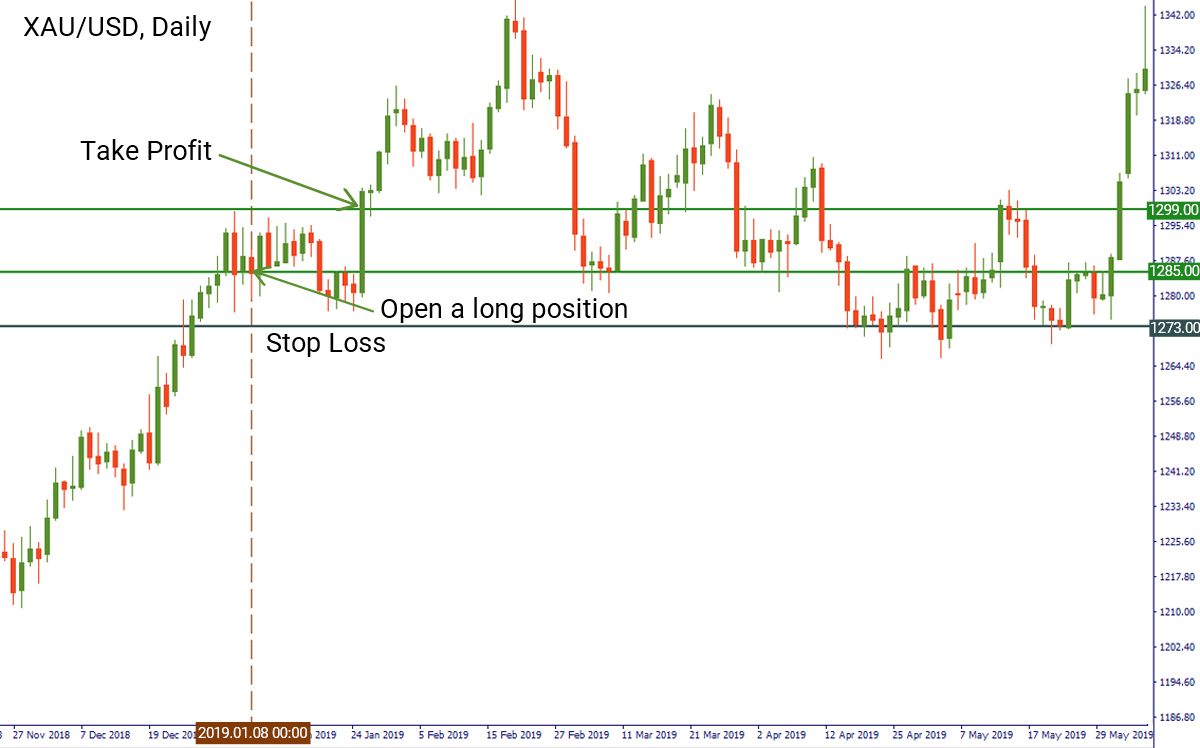
Abre una posición larga en el gráfico del oro en la apertura de la siguiente vela.
Coloca un stop loss en el nivel de soporte significativo antes de la entrada.
Establece un take profit por debajo del siguiente nivel de resistencia significativo después de la entrada.
Ejemplo:
En el gráfico diario del índice dólar, notamos la ruptura del soporte 95.66 el 7 de enero. Después de eso, abrimos el gráfico del oro y entramos en una posición larga en $1285 el 8 de enero. Colocamos el stop loss en el nivel de soporte anterior, en $1273. El nivel del take profit fue de $1299 (un poco por debajo del nivel de resistencia).
Configuración de una operación corta:
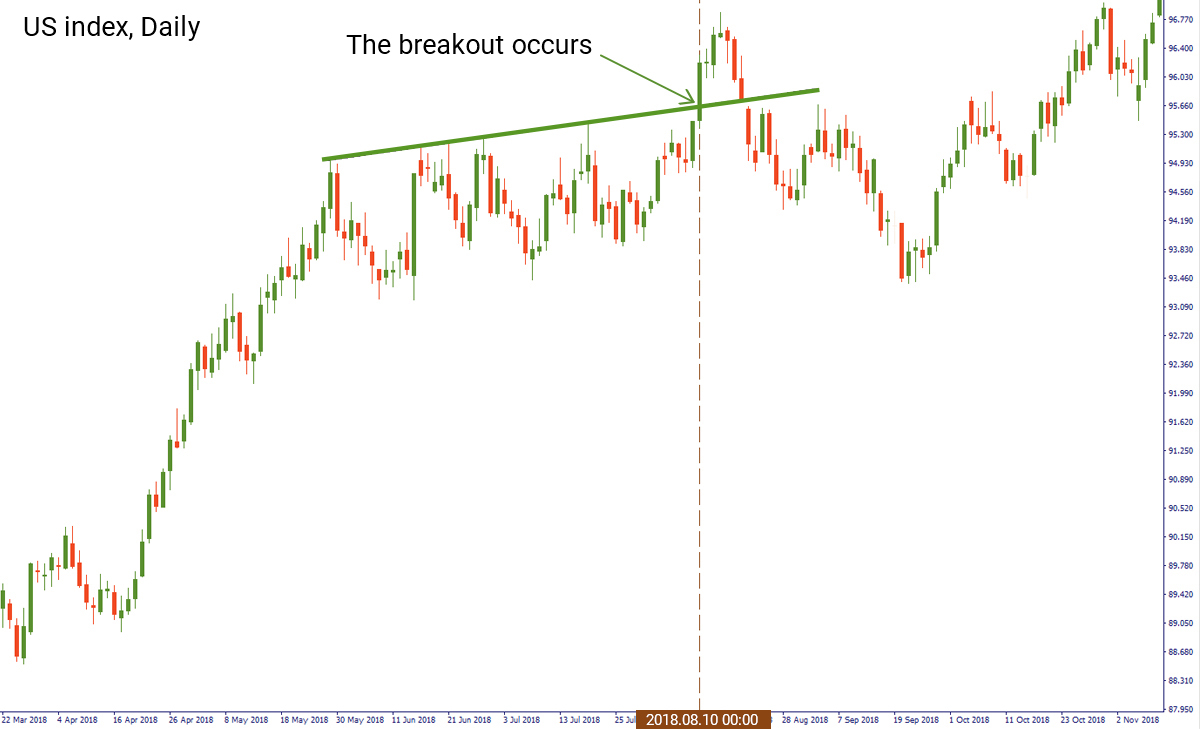
Identifica la resistencia en el gráfico del índice dólar (temporalidad diaria).
Identifica una vela que cierre por encima de la resistencia.
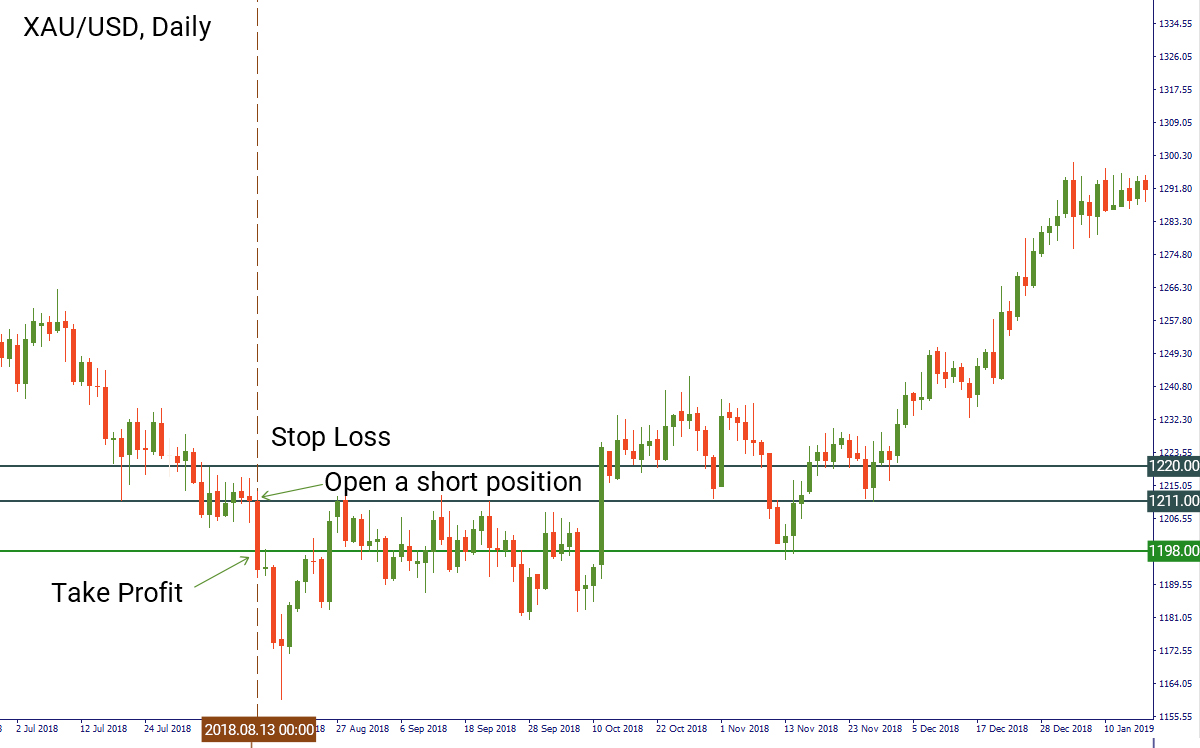
Abre una posición corta en el gráfico del oro en la apertura de la siguiente vela.
Coloca un stop loss en el nivel de resistencia significativo antes de la entrada.
Establece un take profit por debajo del siguiente nivel de soporte significativo después de la entrada.
Ejemplo:
La situación cuando necesitas abrir una posición corta es similar al escenario con una posición larga. El 10 de agosto (viernes), identificamos una ruptura de la resistencia en el gráfico diario del índice dólar. Cambiamos al gráfico de XAUUSD y entramos en una posición corta al precio de apertura de la vela el 13 de agosto (lunes) a $1211. Colocamos el stop loss por encima del primer nivel de resistencia antes de la entrada en $1220. El nivel de take profit estuvo en $1198 (cerca del nivel de soporte).
Resumen
Comprender las correlaciones y el análisis fundamental hace que sea más fácil para un trader de posición captar el movimiento del mercado y abrir una posición en el momento adecuado.