Hay muchas estrategias valiosas que requieren del conocimiento de patrones de velas japonesas y osciladores. Sin embargo, no todas son rentables. Cuando comienzas a operar con ellas, puedes enfrentar situaciones en las que la estrategia no se está moviendo en tu dirección. Eso es lo que sucede cuando no realizas una revisión exhaustiva de tu estrategia de trading. ¡Afortunadamente, probamos varias estrategias basadas en una combinación de osciladores y patrones de velas y elegimos la mejor para ti! ¡Por favor démosle la bienvenida a la Estrategia de RSI y Patrón Envolvente Alcista/Bajista!
Configuración de la Estrategia
Instrumentos: EUR/USD
Indicadores: RSI de 11 períodos
Temporalidad: H4
Reglas de gestión de riesgos: Volumen de trading fijo de 0,1 lote
Reglas para una entrada larga
1. Espera a que se forme un Patrón Envolvente Alcista. Este es el patrón de reversión que se forma al final de una tendencia bajista. Consiste en una pequeña vela roja y una gran vela verde que envuelve a la roja. Las sombras de la vela pequeña son cortas.
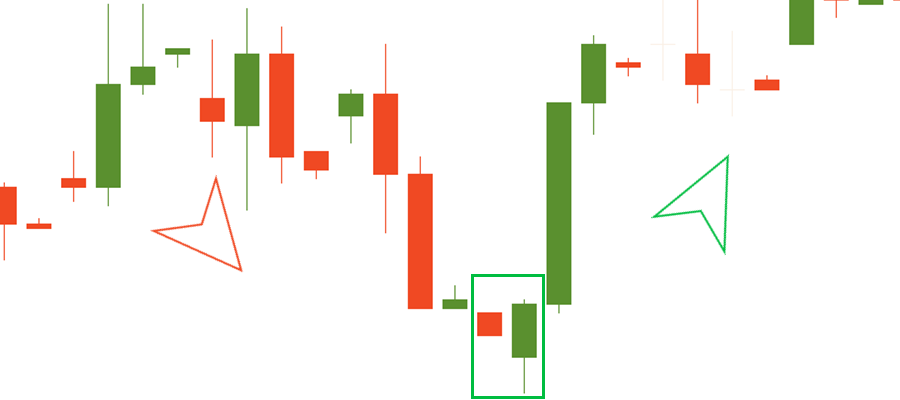
2. El patrón de velas debe ser confirmado por el indicador RSI moviéndose por debajo del nivel 40.
3. Abre tu posición en la siguiente vela después de que se confirme el patrón.
4. Debes cerrar la posición larga cuando el indicador RSI cruce el nivel 70 al alza.
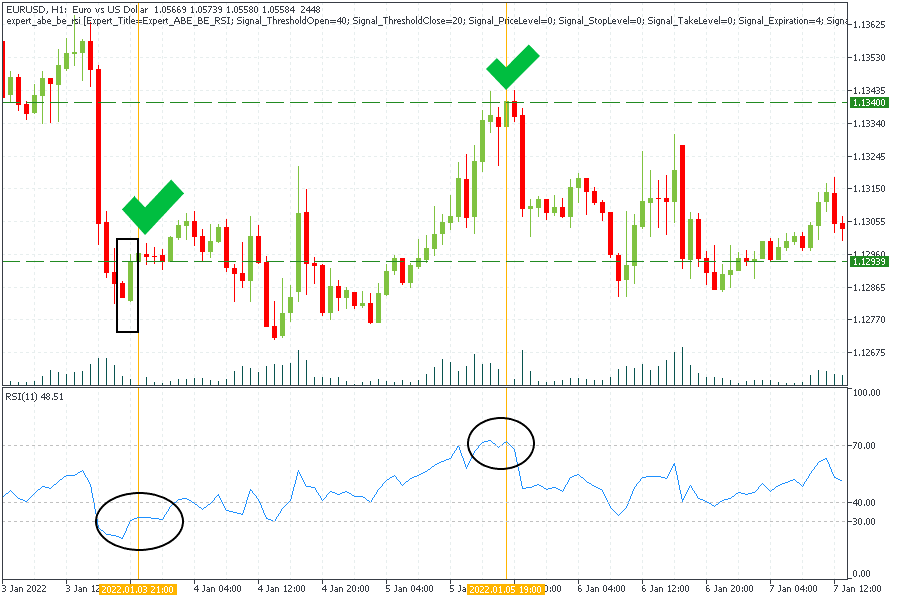
En la imagen de arriba, puedes ver un ejemplo de esta estrategia en la temporalidad H1 del gráfico del EUR/USD.
Después de que el precio formó un patrón conocido como Envolvente Alcista, verificamos el RSI y se movía por debajo del nivel 40. Abrimos una operación larga en el precio de apertura de la siguiente vela alcista después del patrón en 1,12939. Cerramos la operación cuando el RSI cruzó el nivel 70 en 1,1340. Ganamos 461 puntos.
Reglas para una entrada corta
1. Espera a que se forme un Patrón Envolvente Bajista. Consiste en una pequeña vela verde seguida de una gran vela roja.
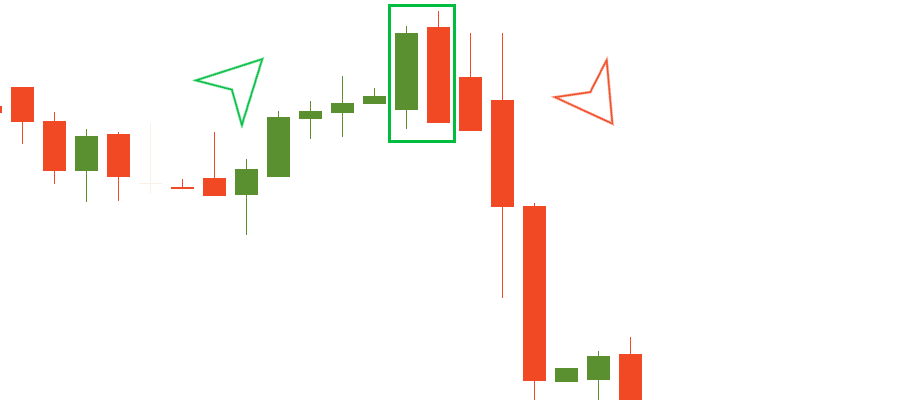
2. El patrón de velas debe ser confirmado por el indicador RSI que debe estar por encima de la línea 60.
3. Después de confirmar el patrón, debes abrir una orden de venta en la siguiente vela. Ésta debería ser bajista.
4. Debes cerrar la posición larga cuando el indicador RSI cruce el nivel 30 a la baja.
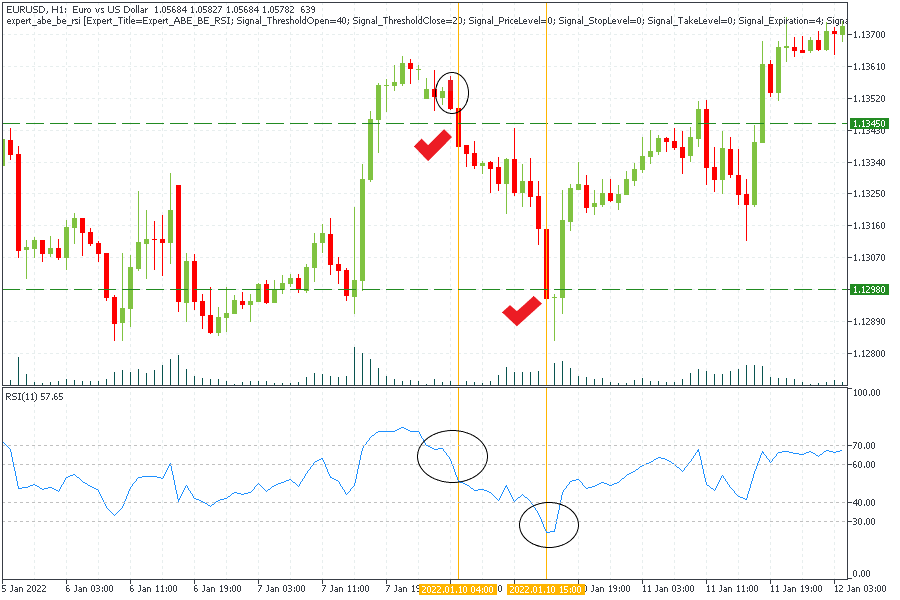
En el gráfico anterior, abrimos una orden de venta después de que el RSI confirmara el patrón Envolvente Bajista moviéndose por encima del nivel 60 en 1,1345. Después de que el RSI entrara en la zona de sobreventa, cerramos nuestra posición en 1,1298. Ganamos 470 puntos.
Backtesting de una estrategia
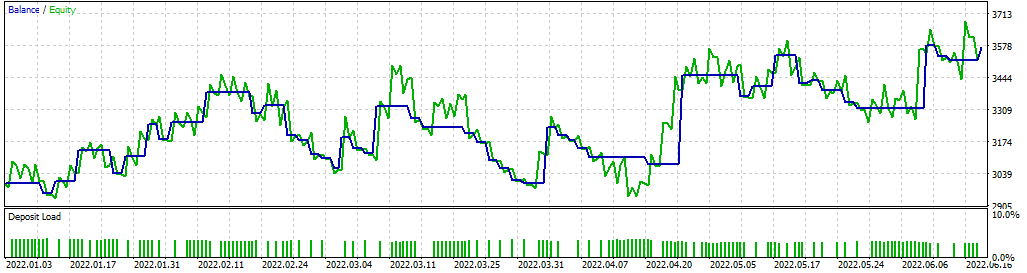
La estrategia fue probada mensual y anualmente y arrojó buenos resultados.
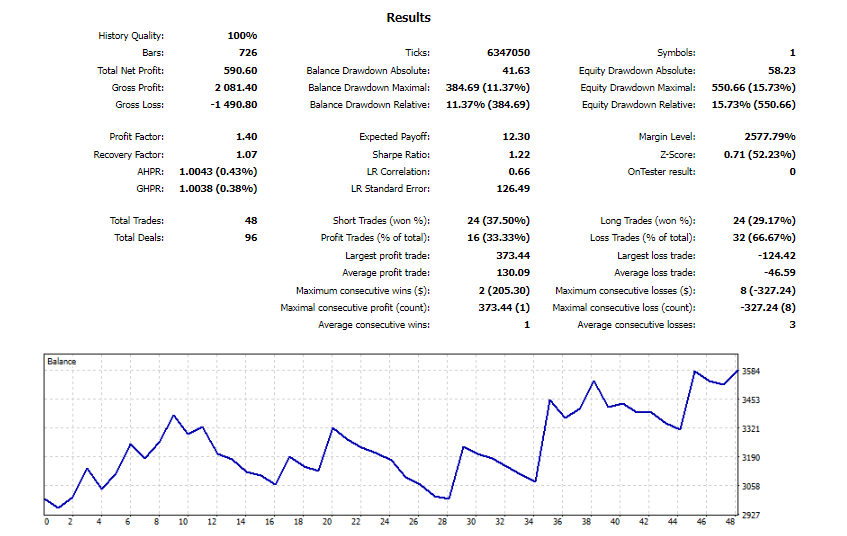
Veamos el factor de ganancias. Esta métrica muestra cuánto dinero ganas en comparación con cuánto dinero pierdes. La prueba de un año un depósito de $3.000 y un apalancamiento de 1:100 mostró un factor de ganancias de 1,40. La cifra es mayor que 1, por lo que la estrategia puede llamarse confiable. Ahora veamos el factor de recuperación. Este es el valor absoluto de la ganancia neta dividido entre el drawdown máximo. El factor de recuperación es 1,07, que también es mayor que 1. Es decir, la cuenta se recupera rápidamente de los drawdowns. Con el tamaño de nuestra cuenta en $3.000, el drawdown máximo del 11% se considera normal.
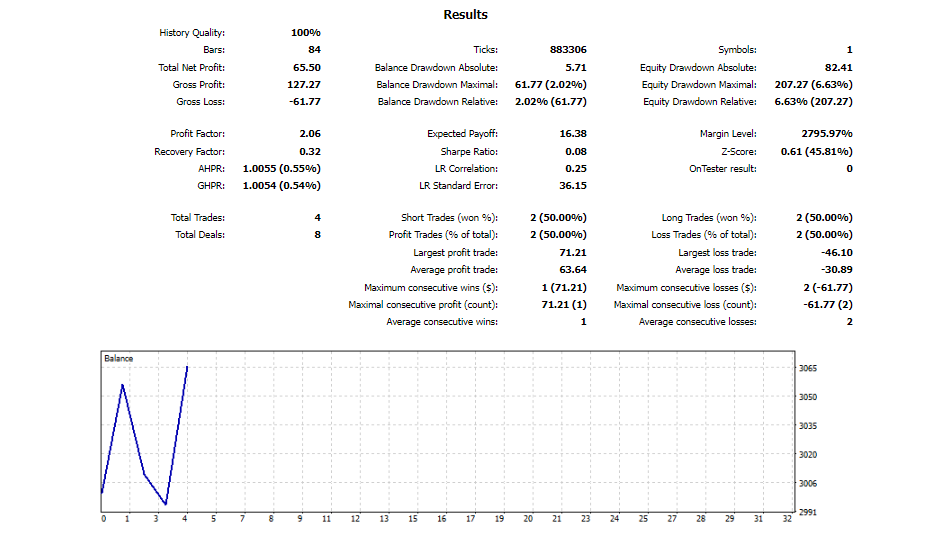
La prueba en un período mensual con los mismos parámetros mostró un factor de ganancias de 2,06, pero el factor de recuperación fue de 0,32. Con el tamaño de nuestra cuenta en $3.000, el drawdown máximo del 2% se considera normal.
Conclusión
Ahora conoces una estrategia de trabajo con un solo oscilador y patrones de velas japonesas. ¡Definitivamente deberías probarlo!